In my 20% time at work, I’ve been writing a Python library for generating charts using Google’s Chart API. It is called graphy, and is now available as open source software on code.google.com.
I’ve frequently wanted to visualize data for various projects I’m working on but have been frustrated because the tools I’ve used are too heavyweight for making simple charts. When the opportunity came up to use the Google Chart API, I jumped at the chance to make a chart library I would enjoy using. The basic philosophy of graphy is to let you present your data naturally and then get out of your way.
I’ll give a couple examples of how it is used. If you’re interested, there are more examples in the user guide and in the source code. First, a simple bar chart showing how population has changed over the past 4 decades in three bay area cities:
from graphy.backends import google_chart_api

cities = ('San Jose', 'San Francisco', 'Oakland')
pop_1960 = (200000, 740000, 370000)
pop_2000 = (900000, 780000, 400000)

chart = google_chart_api.BarChart()
chart.AddBars(pop_1960, label='1960', color='ccccff')
chart.AddBars(pop_2000, label='2000', color='0000aa')
chart.vertical = False
chart.left.labels = cities
chart.bottom.min = 0
print chart.display.Img(300, 180)
That snippet gives this chart:

Next an example using a line chart to compare average temperature trends in two US cities:
from graphy.backends import google_chart_api
from graphy import formatters
from graphy import line_chart

# Average monthly temperature
sunnyvale = \
    [49, 52, 55, 58, 62, 66, 68, 68, 66, 61, 54, 48, 49]
chicago = \
    [25, 31, 39, 50, 60, 70, 75, 74, 66, 55, 42, 30, 25]

chart = google_chart_api.LineChart()
chart.AddLine(sunnyvale, label='Sunnyvale')
chart.AddLine(chicago, label='Chicago',
    pattern=line_chart.LineStyle.DASHED)
chart.bottom.labels = ['Jan', 'Apr', 'Jul', 'Sep', 'Jan']

chart.left.min = 0
chart.left.max = 80
chart.left.labels = [10, 32, 50, 70]
chart.left.label_positions = [10, 32, 50, 70]
chart.AddFormatter(formatters.InlineLegend)
print chart.display.Img(350, 170)
Here’s the resulting chart:

Check out the graphy project page for more information, including the full user guide and source code for graphy 1.0, released under the Apache 2 license.
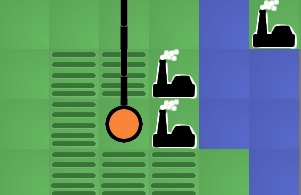
I’m crafting an economy game using Python and Google App Engine. Called Island of Naru, it is a simulation of a small society on a tropical island. The core design revolves around production and trade:
- Towns produce resources based on the surrounding terrain.
- Towns can trade with each other through a complex trading network.
Because terrain affects production, the location of a town matters. A town surrounded by mountains, for example, can’t grow very much corn, while a town surrounded by corn fields can’t mine very much iron ore. The disparity between locations is what drives the need for towns to trade with each other. By trading with each other, our hypothetical mining camp and farming town can become much more prosperous than they could on their own.
The previous release of Island of Naru added simple trade: cities that were connected by roads could exchange goods. The latest version adds simple production: towns near fields will produce food, towns near mountains will produce raw materials, and towns near factories will produce manufactured good. This change is exciting because it means the core game concept is now playable. In essence, this is the first version of Naru which actually resembles the game I set out to build. Now it is possible to start experimenting with the game design, looking for the fun aspects of it and bringing those to the forefront. Much like a rough draft of an essay, the game needs rework and refinement to bring out the best qualities buried inside it. I’ve already done a little exploring with some changes I’ll talk about below, plus I have some half-formed, fuzzier ideas about where the fun may be hiding that I’ll mention at the end.
As soon as terrain-based production was finished, my first thought for improvement was to make the economy more complex by providing ways to enhance production and by adding another resource type: manufactured goods. Production of raw materials can be improved by digging mines in mountains, while irrigating fields increases the amount of food they will produce. Manufactured goods are only available if you build a factory next to a city. These changes gave the game more depth.
 Next I added exploration. I want the player to have to think about where they build their cities, especially the first one. It should be beneficial to hunt around a little for an ideal site, and I think that with a little tweaking, this can be accomplished now that terrain impacts the city’s production. I’m hoping that exploration will help enhance the feeling of landing on a new island and looking for a good spot to build. The island starts out unexplored except for the beach where you came ashore. You can then explore outward from there. I tried making the player explore one tile at a time, but I found that it took too much time: most of the player’s clicks were spent exploring instead of building. That’s not what the focus of the game should be, so I changed the exploration to uncover several squares at a time, which helped. With exploration, the early game is more interesting because the player has to balance exploring with the need to start a town as soon as possible.
Finally I tried to tweak the numbers behind the economy so towns could grow to larger, more realistic populations. This change took more effort than I expected because it uncovered some problems with the way I was calculating demand and the happiness of the population. Fixing it involved modifying the internals of the supply/demand system to allow more control over the minimum and maximum required amounts for each resource. This not only fixed the problem, but also gave me more control over the balance of the game, which may be useful later. The new numbers don’t seem glaringly low, so the game feels more realistic now.
 Even with these improvements, I feel like the fun is still buried. So where should I look next? I have three guesses. First, I suspect the game needs more depth. There are only three resource types at the moment, for example. The trade is also very simple. A more complicated trading network with bottlenecks and different capacities for different types of roads would be much more interesting to manage. Right now, once a player connects all the cities with roads, there is nothing else to manage. There’s no upkeep, improvement, foreign trade, or ports. I expect adding these details will help a great deal once the game is almost finished, but they should probably wait until the bare skeleton of the game is a little more refined. You don’t start decorating a house until after the walls are finished being built.
My second guess for making the game more fun is adding a goal. In its current state, Naru is just a toy, not a game. Sure, the player can invent a goal for themselves, like “highest island population in 100 moves” or “biggest single city” but self-imposed goals aren’t very powerful motivators. I think imposing some goals and adding a high-score table or two would help add a competitive edge to the game. I may add a simple goal just to give some direction to the player and avoid confusion about what they are supposed to be doing, but fancier changes like multiple goals or score tracking need to wait until the core idea provides more fun on its own. High score tables enhance existing fun, they don’t magically make boring tasks fun.
I think the biggest thing hiding the fun is lack of resource constraints on the player. They can build everything for free, so nothing feels valuable. For example, the player should have to agonize a little over the perfect location for their first city, but right now there’s no need: if they find a better location later they can always just build a city there. Similarly for roads: the player should feel a sense of accomplishment when they manage to add a new city to the trading network but since roads are free this isn’t difficult and there’s no sense of accomplishment. A typical game goes something like this: build a city in the flatlands, build a second city by the mountains, build 4 road segments to connect them, build a factory, uhh, now what? 7 moves into the game the player already has access to every resource. Each new city gets connected to the others in a handful of moves, and the end result is that the player doesn’t spend any time thinking about the trading network.
I’m going to try the standard solution to this problem: gold. Make the player pay for building cities and roads, so they are more valuable. I’m not sure what the mechanism will be for getting money in the world. Sim City had taxes to raise money, Oasis let you search for followers in the desert, Civilization made you use special “settler” units that were difficult to obtain. Any of these would work; the key thing is that the player has to make choices about what they want to build with limited resources.
If you want to play the game now, even though the fun may still be elusive, go to http://naru.countlessprojects.com. Feedback is always welcome, of course. You can leave it below. I’d be especially interested to hear any thoughts about refining game designs to uncover hidden fun within them.
A simple trick to keep your bathroom mirror from fogging up when you take a shower: get a little bit of soap on your hands, add a little bit of water, and rub it onto the mirror. Try not to rub it around so much that it makes a lot of bubbles, you just want a thin film of soap on the mirror. If you do it right, the soap film will be very clear so you won’t be able to tell it is there. If it is a little blurry, try breathing on it to see if it clears up. Once you have this soap layer, the mirror shouldn’t fog anymore.
Why does this work? On a clean, non-soapy mirror, the warm moist air from the shower causes condensation on the mirror. The water condenses into super tiny droplets that refract the light as it reflects off the mirror, preventing a clear reflection. However, when there is a thin layer of soap on the mirror, it prevents the water from forming droplets. Instead, the water that condenses stays in nice flat sheets and doesn’t interfere with the light. The result is a clear reflection.
Yay, science!
(You can also use this to keep your glasses from fogging up when you exercise in cold weather. My father showed me this trick years ago when we were cross country skiing.)
BEEP BEEP BEEP BEEP…
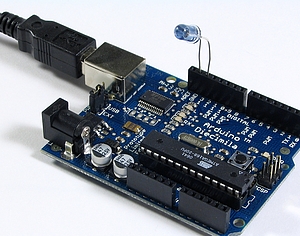
I hate waking up to an alarm clock. Especially on cold, dark winter mornings. My wife and I want to bike to work around dawn (so we can leave work and ride home before dark) which means we have to get up while it is still dark outside. This is painful with a regular alarm, but we’ve been experimenting with a prototype sunrise alarm built with an Arudino.
I’ve noticed that in the spring, when sunrise is getting earlier, it becomes easier to wake up before the alarm goes off. This feels wonderful: instead of feeling groggy, I feel rested and sometimes even energetic. In the fall, though, the trend reverses and it gets harder to wake up as it gets darker each morning. The sunrise alarm counteracts this trend by simulating an early sunrise, making sure the room is bright when it is time to wake up. This prompts the body to wake up naturally, rather than shocking it awake with loud noises.
The hardware for our prototype alarm is simple: I have a Lutron Maestro wireless light dimmer, and the Arudino is controlling it with a single IR LED. (You can read more about how to use the Arudino as a remote control in this post). The nice thing about controlling the dimmer wirelessly is that everything is 5 volts, and I don’t have to worry about 120 volt shocks.
The software uses the remote control signal code described in the earlier post and combines it with the example from the Arduino DateTime library. The DateTime example has code for setting the clock on the Arudino over USB. I extended the code to set the current time and also set the time for the alarm to go off. The Arduino waits for the alarm time to arrive, then starts sending commands to the light dimmer to slowly turn on the lights. Right now I have it turn them on over the course of 20 minutes.
 At the moment this is just a prototype. I’ve been pretty happy with it so far, so at some point I’ll probably rebuild it using a bare AVR chip (so that I can use the Arudino for other projects). Here are some of the things I’ve noticed so far from using it:
- Using the regular lights in our room guarantees that it is bright enough to wake us up. It is a little too bright, actually. I might put lower-wattage bulbs in.
- I originally had it turn the lights on over 15 minutes. However, that felt too sudden. I kept waking up when it was already pretty bright. I slowed it down to take 20 minutes total; it ramps up to half brightness over the first 15 minutes then up to full brightness in the last 5 minutes. This seems to be more gentle. It might be worth experimenting with even longer periods of time, like 30 minutes.
- The Arudino Diecimila resets when it is connected or disconnected from USB, losing the time. However, if you just yank the USB cable it won’t reset. This is nice because otherwise I’d have to leave my laptop turned on all night just so the Arudino wouldn’t lose the time. Leave the IDE running and connected to the Arduino, then unplug the cable without disconnecting in software. You’ll need to have the Arduino powered from a dedicated power supply so there’s still power after the USB is unplugged.
- I originally had it run once and then stop, but that meant I had to set the alarm again every day which was a hassle. I changed it to automatically move the alarm time forward 24 hours, which is much more convenient (but also risky…if I forget and leave it running when we go on a trip, it will turn the lights on and leave them on).
- Bugs in this type of device are annoying. If you make a coding mistake, it might turn the lights on in the middle of the night, or turn them on and leave them on all day. It might also fail to work at all, letting you oversleep.
We’re still setting our regular alarm to go off a few minutes after the lights reach full brightness, just in case we don’t wake up. (I may add a speaker to the finished alarm to consolidate this). Most days I’m already awake or just lightly dozing when it goes the regular alarm goes off, which is good. It feels much more civilized than getting dragged out of bed in the dark by that awful beeping.
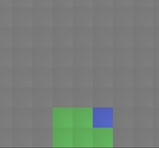
The latest installment of Naru (an island economy game) joins the economy simulation and the island maps. Now when you create an island, it will have the economy engine I wrote about earlier running behind the scenes. This means that cities can trade with each other if you connect them with roads. By clicking on the city names, you can control the production levels of the cities and see graphs of population trends in the city.
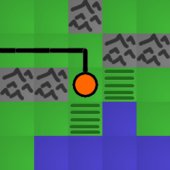
I also improved a few issues in the UI. The squares of the map are now shaded slightly, making it easier to click the square you intended to. Also, cities will automatically connect to roads now; you don’t have to build both a city and a road on the same square.

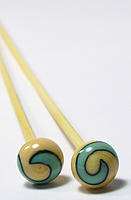
I previously mentioned yanaknits.com, a site started by my wife to teach people how to knit. She’s written instructions for all kinds of knitting projects, from a scarf and mittens to a soccer ball. Now she is collaborating with a friend to create hand-crafted knitting needles. They are bamboo needles with beautiful glass tops, lovingly packaged, and would make really wonderful gifts for anyone who enjoys knitting.
The glass tops come from Andru Anderson’s Kodiak Glass. Andru has been working with glass for about 8 years now, learning different styles and techniques and creating glass jewelry and art. He does a lot of torch work to create glass beads and small sculpture. He has also taught classes at the Bay Area Glass Institute. The small glass beads he created for the needles are gorgeous and unique.
Check out the store here!

New Designs!
If you’re interested in the G-4 glider, you might also like some of my newer
designs.


See newer designs
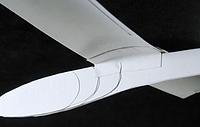
G-4
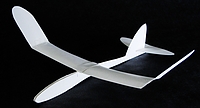
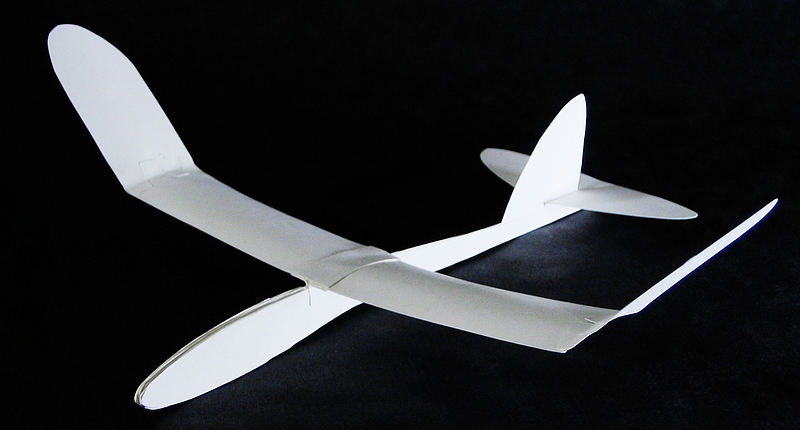
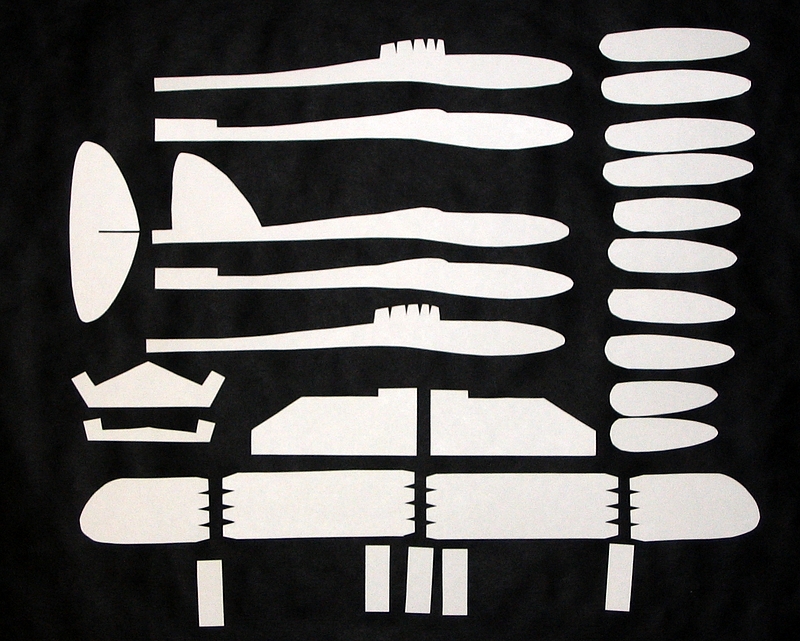
Here are plans for a laminated paper airplane: the G-4 glider.
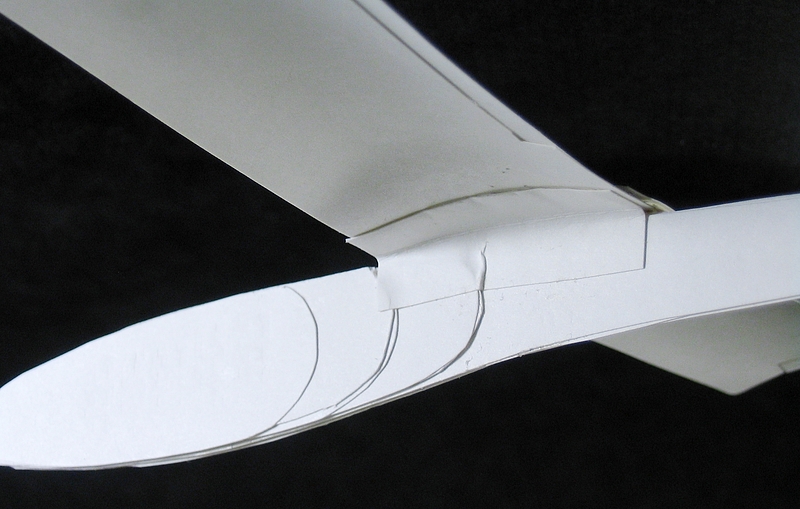
If you haven’t built one of these before, I would suggest that you start with the simpler G-1 glider. It has simpler wings which are easier to assemble. Also, that page explains some construction tips that I won’t bother to repeat here. After you’ve build a G-1, the G-4 will be very similar. The main difference is longer wings with small winglets at the end.
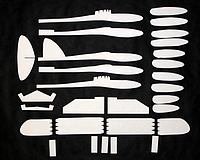
You don’t necessarily have to stick to the plans. If you want to experiment, here are some simple modifications you might try:
- Try lowering the angle of the wing tips to see if you get better performance. The plans call for 25 degrees at the wing tips, but I think that might be too aggressive. Try a smaller angle and see if the plane flies farther.
- You can get a plane without any markings on it by printing the plans out on a separate piece of normal paper (not the thick card stock). Then tape the plans to the card stock and cut out the pieces. You’ll end up with clean pieces, with no lines on them, which I find aestheically pleasing.
- If you shrink the plans before you print them, you can make smaller planes. You could try to make larger planes too, but I suspect the paper wouldn’t be strong enough.
Once you’ve built a plane, find a large outdoor area to fly it, because these planes can fly a long way. Even in a decent-sized yard it often goes over the fence into the neighbor’s yard. An empty softball field works well. Check here for tips on tuning and flying your plane.
 Download G-4 plans (rev. 2):
It is really easy to build a universal remote using an Arduino. With just an infrared LED, it can impersonate remotes for your TV, fans, lights, etc. and can let you easily incorporate these into your electronics projects. You won’t even have to solder anything or void any warranties.
For a project I’m working on, I need to emulate the remote for a Lutron Maestro light dimmer. It uses a modulated IR signal, which is a common way for remotes to communicate and is easy to generate with an Arduino. The basic scheme is simple: each command is sent as a series of pulses representing bits, which can be either 1 or 0. To send a 1, you rapidly blink the LED on and off at 38 kHz, and for 0 you leave the LED off. (The 38 kHz modulation makes the signal more resistant to interference from other light sources).
Decoding the Signal
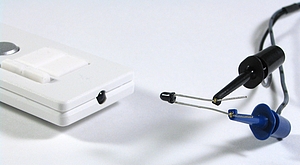
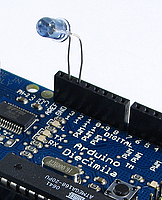
To decode what the remote was sending, I used an oscilloscope and a small photodiode. The photodiode generates a small amount of voltage when light hits it, and responds to changes in light level quickly enough that the oscilloscope can draw a really nice plot of the signal. I have a Parallax USB oscilloscope, which is perfect for showing the command pulses and is just fast enough to find the modulation frequency. As an aside, I’m really happy with the Parallax oscilloscope for projects like this. It is simple to use and I love being able to save images to share with people.
Here’s what two of the commands from the dimmer remote look like. The top signal is the “fade lights up” command, and the bottom one is “fade lights down”:
I captured several different commands, then measured the length of all the pulses. Looking at all the commands, a couple patterns are obvious:
- The entire command takes 82.8 ms (after which it immediately repeats, presumably because I held the button on the remote down a little too long).
- The lengths of the on/off pulses are all multiples of 2.3 milliseconds (which means that the entire 82.8 ms command represents 36 bits of data).
- The last four bits are always 0, so really each command is four bytes long, followed by four 0 bits
The particular remote I’m emulating has five commands, and once they are decoded they look like this:
fade up        = [255, 136, 130, 34]
fade down      = [255, 136, 130, 20]
full on        = [255, 136, 132, 184]
full off       = [255, 136, 189, 18]
memory recall  = [255, 136, 132, 183]
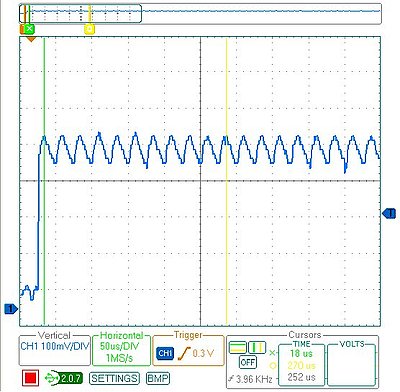
The one other missing piece of information is the modulation frequency which can be measured by zooming in on any of the pulses. This remote uses a frequency of 39.68 kHz. (In the plot below, it says the frequency is 3.96 kHz because I included 10 pulses in the measurement to increase accuracy)
Programming the Arduino
Using an Arduino makes the circuit really simple. I put an IR LED between pin 13 and ground. Since pin 13 has an internal resistor, that’s all that’s required. The code is also pretty straightforward:
/* Control a Lutron Maestro light dimmer */
#define BIT_IS_SET(i, bits)  (1 << i & bits)

// LED connected to digital pin 13
const int LED_PIN = 13;
// Width of a pulse, in microseconds
const int PULSE_WIDTH = 2300;
// # of bytes per command
const int COMMAND_LENGTH = 4;

const int UP[]     = {255, 136, 130, 34};
const int DOWN[]   = {255, 136, 130, 20};
const int ON[]     = {255, 136, 132, 184};
const int OFF[]    = {255, 136, 189, 18};
const int RECALL[] = {255, 136, 132, 183};

void setup()
{
  pinMode(LED_PIN, OUTPUT);
}

/* Modulate pin at 39 kHz for give number of microseconds */
void on(int pin, int time) {
  static const int period = 25;
  // found wait_time by measuring with oscilloscope
  static const int wait_time = 9;

  for (time = time/period; time > 0; time--) {
    digitalWrite(pin, HIGH);
    delayMicroseconds(wait_time);
    digitalWrite(pin, LOW);
    delayMicroseconds(wait_time);
  }
}

/* Leave pin off for time (given in microseconds) */
void off(int pin, int time) {
  digitalWrite(pin, LOW);
  delayMicroseconds(time);
}

/* Send a byte over the IR LED */
void send_byte(int bits) {
  for (int i = 7; i >= 0; i--)
  {
    if (BIT_IS_SET(i, bits)) {
      on(LED_PIN, PULSE_WIDTH);
    } else {
      off(LED_PIN, PULSE_WIDTH);
    }
  }
}

/* Send a full command */
void command(const int bytes[]) {
  for (int i = 0; i < COMMAND_LENGTH; i++) {
    send_byte(bytes[i]);
  }
  off(LED_PIN, 4 * PULSE_WIDTH);
}

void loop()
{
  command(UP);
  delay(1000);
  command(DOWN);
  delay(1000);
}
Checking the Arduino with the Oscilloscope
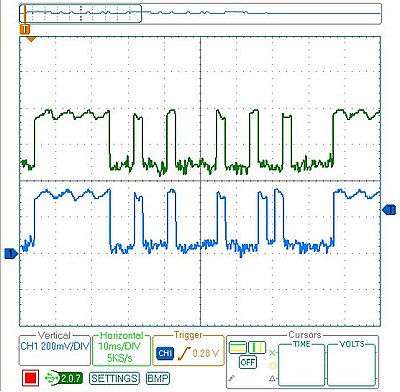
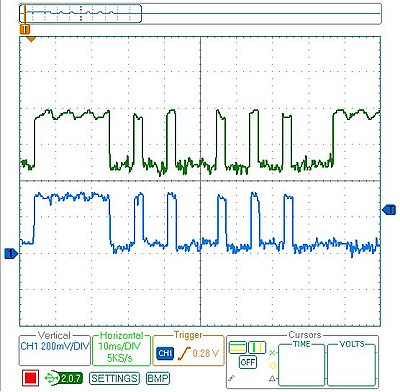
After programming the Arduino, I used the oscilloscope to check the output of the Arduino vs. the original remote. On my first attempt, the wait_time in on() was too long, so the command was stretched out. I hadn’t accounted for the fact that the digitalWrite() calls would consume some time, so I just decreased wait_time until the length of the overall command was correct. As you can see, the final synthesized command overlaps exactly with the authentic one. The green signal on top is from the remote, and the blue signal on the bottom is the arduino:
Final Test
Once everything was ready to go, it was time for the last test: I tried using the Arduino in place of the remote and it worked! It was able to control the light dimmer flawlessly. This lets me finish my project, plus now that I have all the code written it should be easy to adapt to other remote control devices.
Normally there are all kinds of aspects to a simulation that are driven by mathematical functions, like gravity, momentum, population growth rates, economic trends, etc. However, mathematical functions can be difficult to tweak, and I’m finding it much easier to use lookup tables instead. This makes it much easier to make slight modifications: rather than adding additional terms to a function, I just have to modify the values in a table.
I wrapped up the logic for storing a table of points and providing interpolated values between those points into a Python class. Using Python’s __getitem__ method lets my object behave like an array, so I can just index into it when I need a value. Here’s the class:
class InterpolatedArray(object):

  """An array-like object that provides
  interpolated values between set points."""

  def __init__(self, points):
    self.points = sorted(points)

  def __getitem__(self, x):
    if x < self.points[0][0] or x > self.points[-1][0]:
      raise ValueError
    lower_point, upper_point = self._GetBoundingPoints(x)
    return self._Interpolate(x, lower_point, upper_point)

  def _GetBoundingPoints(self, x):
    """Get the lower/upper points that bound x."""
    lower_point = None
    upper_point = self.points[0]
    for point  in self.points[1:]:
      lower_point = upper_point
      upper_point = point
      if x <= upper_point[0]:
        break
    return lower_point, upper_point

  def _Interpolate(self, x, lower_point, upper_point):
    """Interpolate a Y value for x given lower & upper
    bounding points."""
    slope = (float(upper_point[1] - lower_point[1]) /
             (upper_point[0] - lower_point[0]))
    return lower_point[1] + (slope * (x - lower_point[0]))
You use it like this:
points = ((1, 0), (5, 10), (10, 0))
table = InterpolatedArray(points)
print table[1]
print table[3.2]
print table[7]
Here are some examples of the kinds of curves you can easily make:

points = [(0, 0), (2, 9.5), (4, 8.5), (6, 4), (8, 1), (10, 0)]

points = [(0, 10), (2, 10), (4, 9), (6, 7), (8, 4), (10, 0)]

points = [(0, 0), (2, 0), (4, 1.5), (6, 8.5), (8, 10), (10, 10)]
Feel free to use this in your own projects.
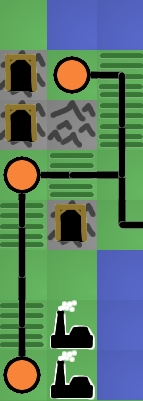
 After prototyping the basic map editor, I’ve switched to working on the backend of Naru recently. Specifically, I’ve been working on the simulation of the island’s economy, which is going to be the meat of the game.
My approach has been to create a dashboard that exposes the interesting stats and graphs them over time. I’m trying to make it easy to visualize what happens when I tweak the various values. I’ve found the graphs to be really helpful in illustrating how trends work their way through the system. I can do something like connect two cities (so they can trade), then run through several turns watching how the populations grow & shrink until they hit a new steady state.
I think I have the simulation to a point where it is starting to be convincing. The population of each city depends on whether the citizens are happy, which in turn depends on whether their needs are met. For example, if they don’t have enough food, they will be unhappy and will eventually move away. If they have an abundance of food, they will be very happy and more people will move in to the city. At the moment I only have 2 resources in the simulation: food and raw materials (which could some day be turned into manufactured goods in a factory). Cities can be connected by roads, in which case surpluses can be distributed to other cities. This means that the total population of the island should increase as more towns become connected (because the surpluses won’t be wasted). The only control the player has is over the amount of resources produced by each city and the road connections between cities.
If you want to play with the simulator, you can get started by going to http://naru.countlessprojects.com/island/economy
I’m pretty sure there are still lots of bugs in it. I haven’t written tests for most of the code because it is still very much a prototype. Still, any feedback you have would definitely be appreciated.