I've been learning WebGL and have been confused how alpha blending works.
Coming from working with the 2D <canvas> API, the WebGL behavior was was
surprising to me.
(This post uses some recent HTML5 features which won't show up properly in
older browsers or IE. I know Chome and Firefox will show it correctly).
The Problem
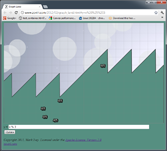
The demo below uses WebGL to draw white, gray, and black triangles in a
range of alpha values, all with the standard gl.BlendFunc(gl.SRC_ALPHA,
gl.ONE_MINUS_SRC_ALPHA). The results are weird. For example, why does the
row of black triangles get lighter than the background as alpha
decreases? If you change the background to be almost-but-not-quite
white, why do the white triangles stop fading entirely?
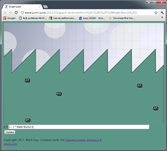
For reference, here's a version done using the canvas API
which behaves as expected and clearly shows the differences in alpha behavior
between canvas and WebGL:
The Answer
As I learned from
Gregg Tavares,
the answer to the puzzle is that WebGL blends the alpha channel differently than
canvas does. Using the standard gl.BlendFunc(gl.SRC_ALPHA,
gl.ONE_MINUS_SRC_ALPHA), WebGL's blending equation for alpha is:
A = Asrc * Asrc + Adest * (1 - Asrc)
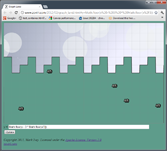
If you start with an opaque buffer and render a
semi-transparent polygon, the result is that the buffer is now
semi-transparent (A = .5 * .5 + 1 * (1 - .5) = .75).
This transparency allows the white background of the page to show through and
blend with the WebGL colors. Putting text behind the WebGL canvas makes
this obvious:
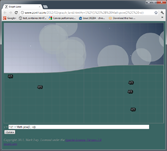
Gregg details
several ways to address this, including using { alpha: false } when
requesting the context:
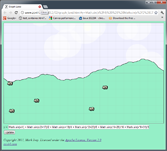
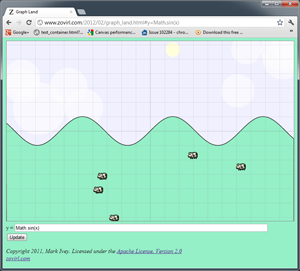
Graph Land is a graphing calculator for Javascript. In addition to such useful
features as the ability to plot Math.cos(Math.floor(x*2)), it
also has adorable cows, clouds, dusk, dawn, and other such fine accoutrements
which all fashionable graphing calculators in this modern age aspire toward.
Try it now
A brief account of the creation of Graph Land
A flight simulator I've been working on needed some interesting terrain for the
player to fly over. I saw two solutions: use a level editor to create some
interesting terrain (the manual route), or make an algorithm that generates
interesting terrain (the procedural route). Making levels by hand is tedious and
time-consuming, so I chose procedural terrain generation, which is also
time-consuming but more entertaining.
To get rapid feedback while working on the terrain I made a simple app that
plotted the output of the algorithm as I tweaked the parameters. It was
basically a graphing calculator that took a Javascript expression as input. I
used the app to get an algorithm capable of producing convincing hills and
mountains, then moved on to work on other things.
Later, I found myself coming back to this app to visualize other things. I used
it to tune the length of daytime/nighttime (a modified sine wave) in a different
game. Then I needed to smoothly switch colors in another app and I knew the
shape of the curve I wanted, but I didn't know what the actual formula was until
I messed around in the graphing app for a few minutes and found it.
Much later, cows wandered in. Shortly after that clouds formed in the sky.
Eventually the sun, showing no respect for the traditional order of creation by
its tardiness, started making a daily appearance.
I've found Graph Land useful. I'm publishing it so others can use it too. The
whole thing is licensed under the Apache 2 license, so feel free to reuse it in
other projects.
Appendix A
A collection of examples, most of which may be useful to game programmers:
Javascript's % operator (A) behaves like C not like Python,
which always frustrates me when x is negative. I usually end up
using (B) instead. Rounding down (C) gives a formula that converts any value of
x to a valid index into an array of length 3.
Smooth transitions can be down with a modified logistic function (D), which
is very easy to tweak ((A) gives a slow transition, (E) is much more abrupt). A
much faster but less flexible approach is 3x^2-2x^3 (F).
Sometimes you want abrupt transitions, not smooth transitions. (G) and (H) will
give you those.
Appendix B
Convincing random terrain is largely a matter of mixing several frequencies
together.
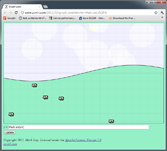
If you use your imagination, you can pretend this is a hill even though it is
too smooth:
y = Math.sin(x/4)
Adding in another higher-frequency, lower-amplitude sine wave makes a
subtle improvement:
y = Math.sin(x/4) + Math.sin(x/2+17)/2
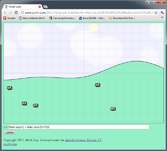
(The "+17" bit offsets the second sine wave so both waves don't cross (0, 0)
together.)
If you keep adding in higher-frequency, lower-amplitude waves you can see the
hill gets more and more detail:
The terrain in my flight simulator works the same way except that I use
random noise instead of sine waves for the basic input, so instead of combining
many layers of sine waves, it is combining many layers of random noise.
I wrote earlier
about Forest, a meditation game I made for the Super Friendship Club's Mysticism
Pageant (you can play it here). That article covered my motivations and inspirations, but
not the details of how it was put together. This article covers the details.
Overview
The game uses HTML5, specifically the <canvas> tag for graphics and the
<audio> tag for music. The world is procedural, which means that
instead of using photoshop to paint the levels by hand I made some algorithms to
generate the world. This has two advantages:
- It is a very fast way to get a lot of variety, which helps the world look
natural and convincing.
- It was more fun. I didn't have to sit down and paint 20 or 30 different
trees by hand.
I worked on this in the evenings and on weekends for about three weeks during
the pageant, and then spent a couple more weeks cleaning things up and polishing
it after. It is about 1500 lines of JavaScript.
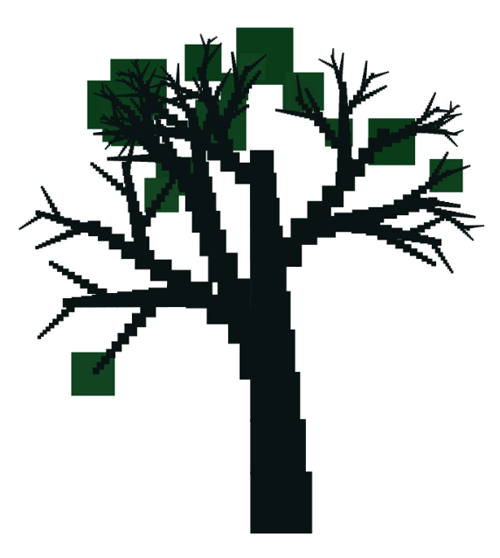
Procedural Trees
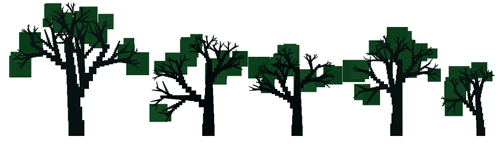
I had the good fortune to be able to work on the code for generating the
trees while sitting on the porch of a cabin near Lake Tahoe. It was quite
relaxing, reclining in the shade of towering pine trees while making a virtual
forest.
The normal way of doing procedural trees appears to be L-systems, but that
seemed too complicated. I did something simpler:
- Trees are made up of blocks of varying sizes and colors.
- Blocks are laid out in straight lines to make branches, with blocks
getting smaller along the branch.
- Starting from the main branch (the trunk), side branches split off
recursively.
- Lengths and angles are randomly jittered, so some branches are longer,
some are shorter, they branch off at slightly different angles, etc.
- At the end of some branches a foliage block is added in a somewhat-random
shade of green.
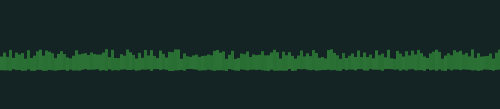
Procedural Grass and Dirt
Grass has somewhat random heights and colors:
// Returns a css color string like "rgb(30,40,50)"
function rgb(r,g,b) {
  var f = Math.floor;
  return "rgb(" + f(r) + "," + f(g) + "," + f(b) + ")";
}

var width = 3;
for (var x = 0; x < SCREEN_WIDTH; x += width) {
  // Draw one blade of grass
  var shade = Math.random() * 5;
  context.fillStyle = rgb(40 + shade, 110 + shade, 50 + shade);
  var depth = Math.random() * 2;
  var height = depth + 10 + Math.random() * 10;
  context.fillRect(x, SCREEN_HEIGHT - GROUND_HEIGHT + depth, width, -height);
}
(I didn't bother including it in the sample code, but there's also a little
logic to adjust the color if the grass is in a sunbeam)
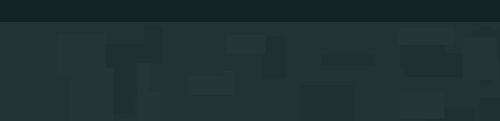
The dirt has randomly-sized dark and light rectangles layered on it:
// Ground
context.fillStyle = "rgb(35, 50, 50)";
context.fillRect(0, SCREEN_HEIGHT, SCREEN_WIDTH, -GROUND_HEIGHT);

// Dark spots
context.fillStyle = "rgb(32, 47, 47)";
for (var i = 0; i < 20; i++) {
  context.fillRect(Math.random() * SCREEN_WIDTH,
    SCREEN_HEIGHT - Math.random() * GROUND_HEIGHT,
    Math.random() * 50 + 10,
    Math.random() * 50 + 10);
}

// Light spots
context.fillStyle = "rgb(38, 53, 53)";
for (var i = 0; i < 20; i++) {
  context.fillRect(Math.random() * SCREEN_WIDTH,
    SCREEN_HEIGHT - Math.random() * GROUND_HEIGHT,
    Math.random() * 50 + 10,
    Math.random() * 50 + 10);
}
Canvas optimizations
I started out just drawing the entire canvas from scratch in every frame,
using fillRect() calls for almost everything (remember, the grass, dirt, trees,
and player are all made out of blocks). Performance was terrible.
I did some testing and found that at 30 FPS I could only
expect to get 5000 100x100 pixel fillRect() calls. That's not nearly enough.
Each tree is built from about 1000 blocks so that would only get me five trees.
Worse, <canvas> appears to be fillRate() limited. If I want to fill the whole
800x600 canvas, I only get 500 fillRect() calls.
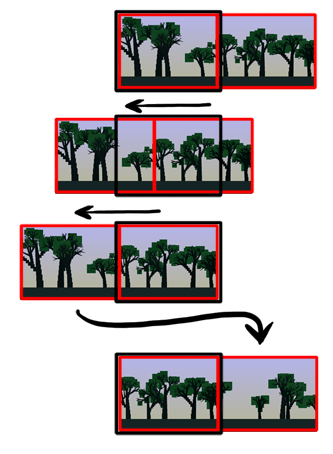
Since the trees don't change, I looked into pre-rendering them to off-screen
canvas elements, then using drawImage() to copy them into the main canvas.
Performance testing suggested that at 30 FPS I could get about 35 800x600
drawImage() calls. This is more than enough, since I only need 3 layers of
trees to give enough depth.
For scrolling, there are two canvases for each layer. When one of the
canvases scrolls off the left side of the main canvas, it is redrawn and starts
scrolling in from the right side of the main canvas. This means in total, there
are only 8 drawImage() calls per frame (three tree layers plus one ground layer,
two canvases per layer).
Colors
I tried different color palettes:
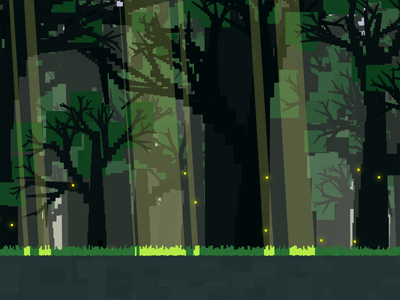
- Warm tones with plenty of yellow in the shades of green. This helped
create the warm, lazy summer afternoon feel I wanted.
- Cooler blue tones to help make the yellow fireflies stand out. The
fireflies looked great but the forest felt too cold.
- A day/night cycle slowly changing between bright, warm greens in the daytime and dark,
cool blues at night (there were even stars which came out at night). This
turned out to not be as awesome as I had imagined.
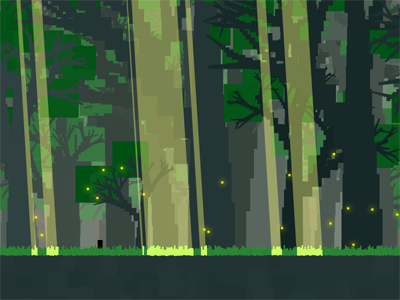
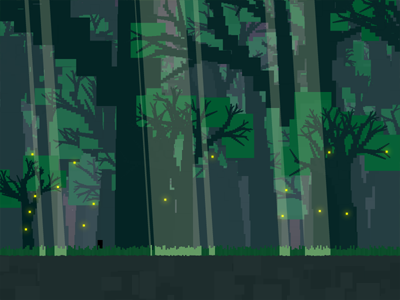
In the end, I compromised and ended with with a somewhat cooler version of
#1:
Text
I browsed through Google's
repository of web fonts until I found Tangerine Bold,
which I think goes very nicely with the theme.
I wanted to use JavaScript to render the text into the canvas directly, but I
couldn't find a way to make it blocky. The obvious solution is to draw the text
at a small size so the pixels are large in relation to the text, then enlarge
the image. However I couldn't stop the browser from doing interpolated scaling,
so the text ended up blurry instead of blocky.
I gave up on JavaScript for this and used Python instead to pre-render the
text into images. I also added a slight drop-shadow to help the text stand out
from the background. Using images instead of rendering from JavaScript adds
about 300 KB of data to download, but at least it works.

from PIL import Image, ImageDraw, ImageFont, ImageFilter

def colorize(image, textColor, backgroundColor):
  colored = image.convert("RGBA")
  colored.putdata([textColor if value == 0 else backgroundColor
                   for value in image.getdata()])
  return colored

text = "Breathe"
font = ImageFont.truetype('Tangerine_Bold.ttf', 36)

image = Image.new("1", font.getsize(text), '#FFF')
draw = ImageDraw.Draw(image)
draw.text((0, 0), text, font=font)
# Use nearest-neighbor when enlarging to make it blocky
image = image.resize([i*2 for i in image.size], Image.NEAREST)

coloredText = colorize(image, (187, 221, 153), (0, 0, 0, 0))
shadow = colorize(image, (0, 0, 0), (0, 0, 0, 0))
for i in range(3):  # Takes several blurs to get blurry enough
  shadow = shadow.filter(ImageFilter.BLUR)

shadow.paste(coloredText, (0, 0), coloredText)
shadow.save("breathe.png")
Movement
I wanted the movement to have a specific feel:
- Syncing input to breathing gives a slow pace
- Possible to run
- Possible to quickly slow down from a run
When space is held, there's an acceleration which decreases as the player's
speed approaches the target speed. Rapidly clicking space builds up an acceleration boost
which allows running. Finally, drag slows the player down quickly from
high speeds but has little effect at slow speeds.
The acceleration from tapping space once is so small it can barely be
noticed. This gives a bad experience if the player just taps space once at the
start of the game because it looks like nothing happened. To fix this, if the player isn't
moving and space is pressed, the speed jumps straight to the target speed. This provides
nice feedback and makes it obvious that pressing space did something.
function Player() {
  this.x = 0; // position
  this.dx = 0; // speed
  this.ax = 0; // acceleration
  this.clicks = 0;  // Number of times player pressed button within clickWindow
  this.clickWindow = 5; // Number of seconds to measure button presses over
  this.running = false; // True if player is holding down button
  this.targetSpeed = 50; // Desired speed if button is held continuously
}

// dt is how much time has elapsed since the last call to update()
Player.prototype.update = function(dt) {
  // calculate bonus acceleration for clicking button rapidly
  this.clicks = Math.max(0, this.clicks);
  var clickRate = this.clicks/this.clickWindow;
  var boost = 49 * clickRate * clickRate;

  var drag = .003 * this.dx * this.dx;
  this.ax = boost - drag;

  if (this.running) {
    // When running, provide an alternate, possibly higher, acceleration
    this.ax = Math.max(this.ax, boost + this.targetSpeed - this.dx);
  }

  this.dx += this.ax * dt;
  this.x += this.dx * dt;
}

Player.prototype.startRunning = function() {
  if (this.running) {
    return;
  }
  this.running = true;
  if (this.dx == 0) {
    // not moving yet, provide a "kick" so it is obvious something happened.
    this.dx = this.targetSpeed;
  }
  this.clicks++;
  var that = this;
  setTimeout(function() {that.clicks--;}, this.clickWindow*1000);
}

Player.prototype.stopRunning = function() {
  this.running = false;
}

var player = new Player();
var SPACE = 32;
$(document).keydown(function(e) {e.which == SPACE && player.startRunning();});
$(document).keyup(function(e) {e.which == SPACE && player.stopRunning();});
// Prevent space from scrolling the page
$(document).keypress(function(e) {return e.which != SPACE});
Metrics
Google Analytics can do event tracking, which is perfect for gathering metrics on how many players
start the game and how many players make it all the way to the end.
function trackEvent(action) {
  if (_gaq) {
    _gaq.push(["_trackEvent", "forest", action]);
  } else {
    console.log("Analytics not loaded. Not logging event: " + action);
  }
}
Even though the game only lasts five minutes, the metrics made it obvious
that players were leaving before finishing. Based on this, I added the "Breathe"
and "Relax" reminders in the middle to hint that the game doesn't just run on
forever. Metrics showed an improvement in the number of players reaching the end
after this change.
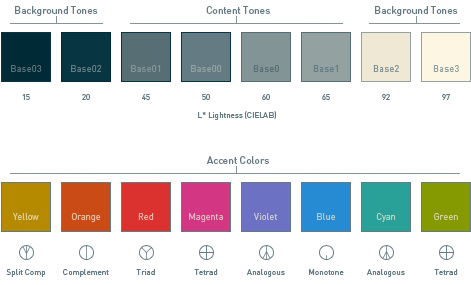
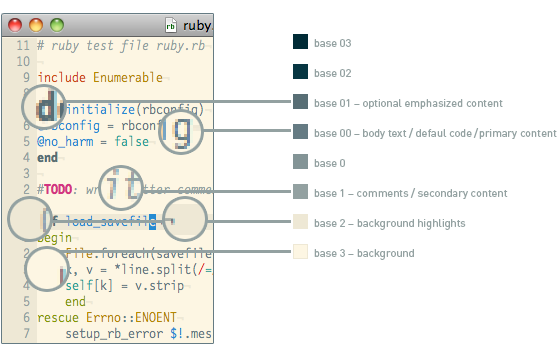
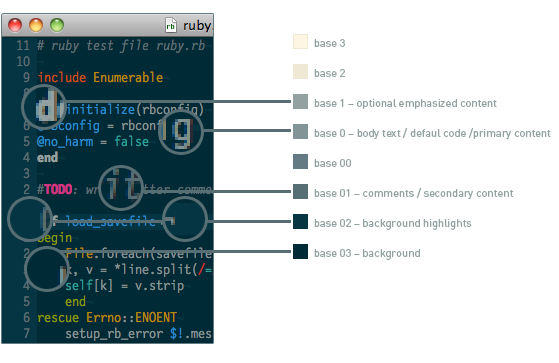
I’ve been enjoying Ethan Schoonover’s Solarized Color Scheme. However,
when setting up various programs to use it, I’ve found I wanted to have the
example pictures right next to the table of RGB/Hex values. This makes it easier
to find a color in the picture then look up the values in the table.
So, here are the images and the table, together:
| SOLARIZED | HEX | RGB | HSB | L*A*B | 16/8 | TERMCOL | XTERM/HEX |
|---|
| base03 | #002b36 | 0 | 43 | 54 | 193 | 100 | 21 | 15 | -12 | -12 | 8/4 | brblack | 234 | #1c1c1c |
| base02 | #073642 | 7 | 54 | 66 | 192 | 90 | 26 | 20 | -12 | -12 | 0/4 | black | 235 | #262626 |
| base01 | #586e75 | 88 | 110 | 117 | 194 | 25 | 46 | 45 | -07 | -07 | 10/7 | brgreen | 240 | #585858 |
| base00 | #657b83 | 101 | 123 | 131 | 195 | 23 | 51 | 50 | -07 | -07 | 11/7 | bryellow | 241 | #626262 |
| base0 | #839496 | 131 | 148 | 150 | 186 | 13 | 59 | 60 | -06 | -03 | 12/6 | brblue | 244 | #808080 |
| base1 | #93a1a1 | 147 | 161 | 161 | 180 | 9 | 63 | 65 | -05 | -02 | 14/4 | brcyan | 245 | #8a8a8a |
| base2 | #eee8d5 | 238 | 232 | 213 | 44 | 11 | 93 | 92 | -00 | 10 | 7/7 | white | 254 | #e4e4e4 |
| base3 | #fdf6e3 | 253 | 246 | 227 | 44 | 10 | 99 | 97 | 00 | 10 | 15/7 | brwhite | 230 | #ffffd7 |
| yellow | #b58900 | 181 | 137 | 0 | 45 | 100 | 71 | 60 | 10 | 65 | 3/3 | yellow | 136 | #af8700 |
| orange | #cb4b16 | 203 | 75 | 22 | 18 | 89 | 80 | 50 | 50 | 55 | 9/3 | brred | 166 | #d75f00 |
| red | #dc322f | 220 | 50 | 47 | 1 | 79 | 86 | 50 | 65 | 45 | 1/1 | red | 160 | #d70000 |
| magenta | #d33682 | 211 | 54 | 130 | 331 | 74 | 83 | 50 | 65 | -05 | 5/5 | magenta | 125 | #af005f |
| violet | #6c71c4 | 108 | 113 | 196 | 237 | 45 | 77 | 50 | 15 | -45 | 13/5 | brmagenta | 61 | #5f5faf |
| blue | #268bd2 | 38 | 139 | 210 | 205 | 82 | 82 | 55 | -10 | -45 | 4/4 | blue | 33 | #0087ff |
| cyan | #2aa198 | 42 | 161 | 152 | 175 | 74 | 63 | 60 | -35 | -05 | 6/6 | cyan | 37 | #00afaf |
| green | #859900 | 133 | 153 | 0 | 68 | 100 | 60 | 60 | -20 | 65 | 2/2 | green | 64 | #5f8700 |
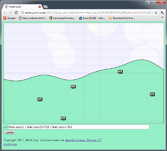
Back in October, Google hosted a two-day HTML5 game jam at their San Francisco office.
Chris Killpack and I both attended
and paired up to make a game. This is a playable log of our progress.
Brief note on the demos: They work in Safari, Chrome, and Firefox. They don't work in Internet Explorer 8. I haven't looked into why (this is game jam code after all).
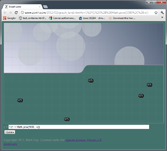
Day 1, 2:45 pm
We got started a bit late and don't have much of a plan. The intial idea is
to make a simple 8-bit fighting game, two player hot-seat. Chris sets up a
repository on his subversion server while I start a simple game loop rendering
to a <canvas> element.
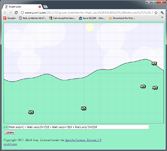
Day 1, 4:00 pm
play
Basic keyboard controls started. A and D move, R punches (we're expecting
the player to use two hands for this, by the way). Chris is working on sprites.
We found a collection of adorable 8-bit versions of Street Fighter characters,
and they're animated. We'll use these as stand-in art until we either can get
permission to redistribute them or until we replace them. [In the end
getting permission got complicated so we drew new art from scratch.] Chris
is converting the animated gifs into sprite sheets and writing a class to
manage them.
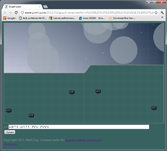
Day 1, 7:00 pm
play
Sprites are working. Now there are keyboard controls for both players
(player one still uses A, D, and R. Player two uses left/right arrow to move
and comma to punch). Moving away makes you block punches. Player health is
shown at the top of the screen, and the game resets when one player runs out of
health.
Added debug mode (press P), which draws the exact locations of the players,
collision boxes and shows keycodes as you press keys.
We have enough working to start tweaking gameplay. Made it so players can't
move while punching. Fiddled with the punching range a lot until it felt right.
Made getting hit push the player back a bit (which makes the punch seem a lot
more powerful).
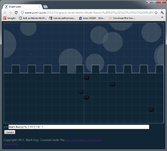
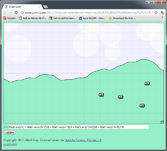
Day 1, 9:15 pm
play
Worried that a straight fighting game will be boring. Decide it should also
be a platformer with pits that the players can fall into. This requires a bunch
of new features:
- Scrolling view
- Left edge of window pushes players along
- Gravity and collision dection with the terrain
- Jumping (to make it over the ledges)
- Random level generator (we don't want to build levels by hand)
Still tweaking the gameplay in a lot of ways:
- Added a pain animation to make it obvious when you get hit.
- Added horizontal acceleration/deceleration which makes the controls feel a lot more "juicy."
- The level generator was putting holes at the start of the level which turns out to be a bad idea (especially if a player starts in a hole). Tweaked it to only put holes in after a certain distance.
- Made movement faster
- Players now face the direction they are moving
Done for the day.
Day 2, 8:45 am
Chris can't make it today. I start off slowly by cleaning up code from
yesterday.
Day 2, 1:00 pm
play
Added throws. You can't block throws, so if someone is blocking all your
punches, throw them. Throws also take a long time, though, so if you miss
you'll be vulnerable.
Made scrolling stop if O is pressed (scrolling is annoying when developing)
Lots of tweaks to the feel of the game:
- Player movement stops when punching and when getting hit.
- Players could punch too frequently, so I made the punch action take a little longer (but kept the animation the same speed so it looks like a good, fast punch. There's just a delay at the end where you can't do anything).
- Always face the other player. Getting in a fight while facing away from the opponent is just weird.
- Made holes deep enough that you can't see the player standing at the bottom
Day 2, 2:00 pm
play
A few more tweaks to gameplay: Players start farther apart, there are more
holes, and players actually die in the holes now.
The official game jam will be over soon so I added some instructions, an
intial "Fight!" screen and a "Game Over" screen. It is surprising how much more
finished this makes the game feel.
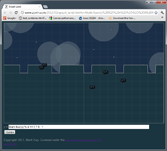
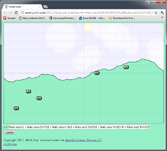
Day 2, 6:00 pm
play
After I got home I worked on the game a little more. Tweaked damage values.
Only start killing players after they fall a long ways into a pit. Made the
game loop exit if you press ESC.
I also added some noise to the sky and ground. This is a trick I learned
from Amit
Patel and it does wonders for pulling things together visually.
This is the final verison of the game. You can get the code to this game on
code.google.com
In addition to the keys documented in the instructions, there are a couple
other keys useful for debugging:
- P: debug mode
- O: stop scrolling
- ESC: quit game loop
(Note: I've modified the code slightly in these snapshots. To make it
easier to post, I've jammed everything into a single .html file instead of
splitting out separate .js files. Also, as mentioned above, these aren't the
character sprites we started with because we didn't have permission to
redistribute those.)
I’ve been thinking for a while now about how software engineers can help their communities. Lawyers have pro bono work. Engineers and contractors can help build houses for people. But computer programming is really specialized; most people don’t need custom computer programs. This spring, though, I found a rewarding way to use my computer science skills: teaching kids how to program. I did this though the Citizen Schools program, which encourages members of the community to share what they know with middle school students. It is a really neat idea: the kids get to learn things their school probably doesn’t have the expertise (or time) to teach, and the “citizen teachers” get a chance to help the community and work with some fun kids. The topics which people teach vary widely. For example, here are some of the topics other people were teaching during this last semester:
- Digital photography. The kids presented a gallery of their photos at a local coffee shop.
- The science (and math) of baseball. 10 teenage boys happily doing statistics for an hour. Awesome.
- Make a text adventure game in Javascript. You can play the game they made right now.
- Cooking and nutrition with a chef from one of Google’s famed cafeterias.
So what did I teach?
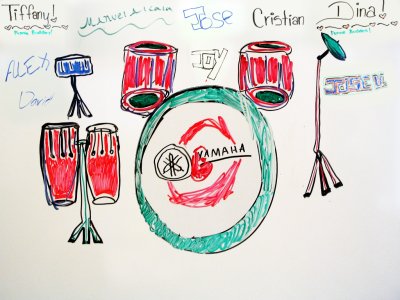
I showed the kids in my class how to use Python to create a drum machine program which plays various drum sounds when you hit different keys on the keyboard. For example, pressing S played the snare drum, C played the cowbell, and B was the bass drum. The finished version of the program had about 20 different drum sounds which the user could play. There were some colorful graphics (drawn by one of the students) showing which drums were being hit. The program could record drum loops, letting the user layer more beats on top of the original beat, and could save and load the sequences of beats. The kids ended up being much better at laying down beats than I was. At the end of the class, the kids presented the program to their parents & teachers, plus had a field trip to a local cafe to demo their work to the community.
What’s it like teaching a class?
Citizen Schools took care of most of the logistics, provided some training on effective ways to teach, and paired us with advisors who helped us work with the children every week. This was really helpful for me, because I was a bit lost figuring out how to present computer programming in a way that middle school students would enjoy. Arturo, my advisor, was super helpful. He worked with the kids every day so he knew them all, plus he had lots of great ideas for ways to present the material and keep the students’ attention.
The semester I taught was a one hour class per week, for ten weeks. That’s not very much time, so I had to work really hard to keep the material short and simple so the kids could learn it. Code is like essays: being terse takes a lot more effort than being verbose. I definitely spent more time preparing for class than I did teaching it.
The kids all knew how to use computers, thanks to myspace, youtube, etc. but none of them had ever written a computer program before. For the first several classes, I would project some simple code and have them type it in and run it. Then I would have them change it or write some similar code. For example, one week we were making the program play different sounds. I showed them how to make it play a snare drum sound, then had them figure out how to make it play a bass drum sound, cymbal sound, etc. They got very good at the repetitive code. There were some one-off lines of code that I don’t think they ever did understand (a function definition, for example).
It was interesting to watch as they learned how to make the computer do what they wanted it to do. I was a little worried a few weeks before the final presentation because the kids weren’t able to explain how to make the program play a new sound. However, when I asked them to code it they knew exactly how to do it. It turns out they just didn’t know the right jargon to explain what they were doing. By the end of the semester, they could make simple modifications to the program to change the way it behaved, or to fix bugs in the code.
Would I do it again?
Will I teach another semester? Yes, I think so. Although it turned out to be a pretty big time commitment this time, I should be able to reuse my lesson plans the next time around so it should be much easier. Like I said at the beginning, it is a really good way to use software engineering skills to help the community and it was really cool to see the students figuring out how to modify their programs on their own. I think that’s reason enough to do it again.
In my 20% time at work, I’ve been writing a Python library for generating charts using Google’s Chart API. It is called graphy, and is now available as open source software on code.google.com.
I’ve frequently wanted to visualize data for various projects I’m working on but have been frustrated because the tools I’ve used are too heavyweight for making simple charts. When the opportunity came up to use the Google Chart API, I jumped at the chance to make a chart library I would enjoy using. The basic philosophy of graphy is to let you present your data naturally and then get out of your way.
I’ll give a couple examples of how it is used. If you’re interested, there are more examples in the user guide and in the source code. First, a simple bar chart showing how population has changed over the past 4 decades in three bay area cities:
from graphy.backends import google_chart_api

cities = ('San Jose', 'San Francisco', 'Oakland')
pop_1960 = (200000, 740000, 370000)
pop_2000 = (900000, 780000, 400000)

chart = google_chart_api.BarChart()
chart.AddBars(pop_1960, label='1960', color='ccccff')
chart.AddBars(pop_2000, label='2000', color='0000aa')
chart.vertical = False
chart.left.labels = cities
chart.bottom.min = 0
print chart.display.Img(300, 180)
That snippet gives this chart:

Next an example using a line chart to compare average temperature trends in two US cities:
from graphy.backends import google_chart_api
from graphy import formatters
from graphy import line_chart

# Average monthly temperature
sunnyvale = \
    [49, 52, 55, 58, 62, 66, 68, 68, 66, 61, 54, 48, 49]
chicago = \
    [25, 31, 39, 50, 60, 70, 75, 74, 66, 55, 42, 30, 25]

chart = google_chart_api.LineChart()
chart.AddLine(sunnyvale, label='Sunnyvale')
chart.AddLine(chicago, label='Chicago',
    pattern=line_chart.LineStyle.DASHED)
chart.bottom.labels = ['Jan', 'Apr', 'Jul', 'Sep', 'Jan']

chart.left.min = 0
chart.left.max = 80
chart.left.labels = [10, 32, 50, 70]
chart.left.label_positions = [10, 32, 50, 70]
chart.AddFormatter(formatters.InlineLegend)
print chart.display.Img(350, 170)
Here’s the resulting chart:

Check out the graphy project page for more information, including the full user guide and source code for graphy 1.0, released under the Apache 2 license.
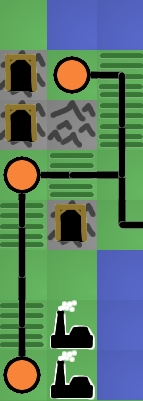
I’m crafting an economy game using Python and Google App Engine. Called Island of Naru, it is a simulation of a small society on a tropical island. The core design revolves around production and trade:
- Towns produce resources based on the surrounding terrain.
- Towns can trade with each other through a complex trading network.
Because terrain affects production, the location of a town matters. A town surrounded by mountains, for example, can’t grow very much corn, while a town surrounded by corn fields can’t mine very much iron ore. The disparity between locations is what drives the need for towns to trade with each other. By trading with each other, our hypothetical mining camp and farming town can become much more prosperous than they could on their own.
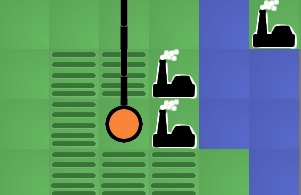
The previous release of Island of Naru added simple trade: cities that were connected by roads could exchange goods. The latest version adds simple production: towns near fields will produce food, towns near mountains will produce raw materials, and towns near factories will produce manufactured good. This change is exciting because it means the core game concept is now playable. In essence, this is the first version of Naru which actually resembles the game I set out to build. Now it is possible to start experimenting with the game design, looking for the fun aspects of it and bringing those to the forefront. Much like a rough draft of an essay, the game needs rework and refinement to bring out the best qualities buried inside it. I’ve already done a little exploring with some changes I’ll talk about below, plus I have some half-formed, fuzzier ideas about where the fun may be hiding that I’ll mention at the end.
As soon as terrain-based production was finished, my first thought for improvement was to make the economy more complex by providing ways to enhance production and by adding another resource type: manufactured goods. Production of raw materials can be improved by digging mines in mountains, while irrigating fields increases the amount of food they will produce. Manufactured goods are only available if you build a factory next to a city. These changes gave the game more depth.
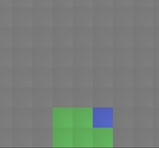 Next I added exploration. I want the player to have to think about where they build their cities, especially the first one. It should be beneficial to hunt around a little for an ideal site, and I think that with a little tweaking, this can be accomplished now that terrain impacts the city’s production. I’m hoping that exploration will help enhance the feeling of landing on a new island and looking for a good spot to build. The island starts out unexplored except for the beach where you came ashore. You can then explore outward from there. I tried making the player explore one tile at a time, but I found that it took too much time: most of the player’s clicks were spent exploring instead of building. That’s not what the focus of the game should be, so I changed the exploration to uncover several squares at a time, which helped. With exploration, the early game is more interesting because the player has to balance exploring with the need to start a town as soon as possible.
Finally I tried to tweak the numbers behind the economy so towns could grow to larger, more realistic populations. This change took more effort than I expected because it uncovered some problems with the way I was calculating demand and the happiness of the population. Fixing it involved modifying the internals of the supply/demand system to allow more control over the minimum and maximum required amounts for each resource. This not only fixed the problem, but also gave me more control over the balance of the game, which may be useful later. The new numbers don’t seem glaringly low, so the game feels more realistic now.
 Even with these improvements, I feel like the fun is still buried. So where should I look next? I have three guesses. First, I suspect the game needs more depth. There are only three resource types at the moment, for example. The trade is also very simple. A more complicated trading network with bottlenecks and different capacities for different types of roads would be much more interesting to manage. Right now, once a player connects all the cities with roads, there is nothing else to manage. There’s no upkeep, improvement, foreign trade, or ports. I expect adding these details will help a great deal once the game is almost finished, but they should probably wait until the bare skeleton of the game is a little more refined. You don’t start decorating a house until after the walls are finished being built.
My second guess for making the game more fun is adding a goal. In its current state, Naru is just a toy, not a game. Sure, the player can invent a goal for themselves, like “highest island population in 100 moves” or “biggest single city” but self-imposed goals aren’t very powerful motivators. I think imposing some goals and adding a high-score table or two would help add a competitive edge to the game. I may add a simple goal just to give some direction to the player and avoid confusion about what they are supposed to be doing, but fancier changes like multiple goals or score tracking need to wait until the core idea provides more fun on its own. High score tables enhance existing fun, they don’t magically make boring tasks fun.
I think the biggest thing hiding the fun is lack of resource constraints on the player. They can build everything for free, so nothing feels valuable. For example, the player should have to agonize a little over the perfect location for their first city, but right now there’s no need: if they find a better location later they can always just build a city there. Similarly for roads: the player should feel a sense of accomplishment when they manage to add a new city to the trading network but since roads are free this isn’t difficult and there’s no sense of accomplishment. A typical game goes something like this: build a city in the flatlands, build a second city by the mountains, build 4 road segments to connect them, build a factory, uhh, now what? 7 moves into the game the player already has access to every resource. Each new city gets connected to the others in a handful of moves, and the end result is that the player doesn’t spend any time thinking about the trading network.
I’m going to try the standard solution to this problem: gold. Make the player pay for building cities and roads, so they are more valuable. I’m not sure what the mechanism will be for getting money in the world. Sim City had taxes to raise money, Oasis let you search for followers in the desert, Civilization made you use special “settler” units that were difficult to obtain. Any of these would work; the key thing is that the player has to make choices about what they want to build with limited resources.
If you want to play the game now, even though the fun may still be elusive, go to http://naru.countlessprojects.com. Feedback is always welcome, of course. You can leave it below. I’d be especially interested to hear any thoughts about refining game designs to uncover hidden fun within them.
BEEP BEEP BEEP BEEP…
I hate waking up to an alarm clock. Especially on cold, dark winter mornings. My wife and I want to bike to work around dawn (so we can leave work and ride home before dark) which means we have to get up while it is still dark outside. This is painful with a regular alarm, but we’ve been experimenting with a prototype sunrise alarm built with an Arudino.
I’ve noticed that in the spring, when sunrise is getting earlier, it becomes easier to wake up before the alarm goes off. This feels wonderful: instead of feeling groggy, I feel rested and sometimes even energetic. In the fall, though, the trend reverses and it gets harder to wake up as it gets darker each morning. The sunrise alarm counteracts this trend by simulating an early sunrise, making sure the room is bright when it is time to wake up. This prompts the body to wake up naturally, rather than shocking it awake with loud noises.
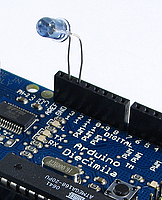
The hardware for our prototype alarm is simple: I have a Lutron Maestro wireless light dimmer, and the Arudino is controlling it with a single IR LED. (You can read more about how to use the Arudino as a remote control in this post). The nice thing about controlling the dimmer wirelessly is that everything is 5 volts, and I don’t have to worry about 120 volt shocks.
The software uses the remote control signal code described in the earlier post and combines it with the example from the Arduino DateTime library. The DateTime example has code for setting the clock on the Arudino over USB. I extended the code to set the current time and also set the time for the alarm to go off. The Arduino waits for the alarm time to arrive, then starts sending commands to the light dimmer to slowly turn on the lights. Right now I have it turn them on over the course of 20 minutes.
 At the moment this is just a prototype. I’ve been pretty happy with it so far, so at some point I’ll probably rebuild it using a bare AVR chip (so that I can use the Arudino for other projects). Here are some of the things I’ve noticed so far from using it:
- Using the regular lights in our room guarantees that it is bright enough to wake us up. It is a little too bright, actually. I might put lower-wattage bulbs in.
- I originally had it turn the lights on over 15 minutes. However, that felt too sudden. I kept waking up when it was already pretty bright. I slowed it down to take 20 minutes total; it ramps up to half brightness over the first 15 minutes then up to full brightness in the last 5 minutes. This seems to be more gentle. It might be worth experimenting with even longer periods of time, like 30 minutes.
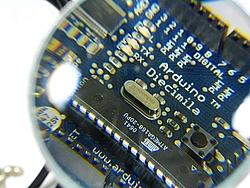
- The Arudino Diecimila resets when it is connected or disconnected from USB, losing the time. However, if you just yank the USB cable it won’t reset. This is nice because otherwise I’d have to leave my laptop turned on all night just so the Arudino wouldn’t lose the time. Leave the IDE running and connected to the Arduino, then unplug the cable without disconnecting in software. You’ll need to have the Arduino powered from a dedicated power supply so there’s still power after the USB is unplugged.
- I originally had it run once and then stop, but that meant I had to set the alarm again every day which was a hassle. I changed it to automatically move the alarm time forward 24 hours, which is much more convenient (but also risky…if I forget and leave it running when we go on a trip, it will turn the lights on and leave them on).
- Bugs in this type of device are annoying. If you make a coding mistake, it might turn the lights on in the middle of the night, or turn them on and leave them on all day. It might also fail to work at all, letting you oversleep.
We’re still setting our regular alarm to go off a few minutes after the lights reach full brightness, just in case we don’t wake up. (I may add a speaker to the finished alarm to consolidate this). Most days I’m already awake or just lightly dozing when it goes the regular alarm goes off, which is good. It feels much more civilized than getting dragged out of bed in the dark by that awful beeping.
It is really easy to build a universal remote using an Arduino. With just an infrared LED, it can impersonate remotes for your TV, fans, lights, etc. and can let you easily incorporate these into your electronics projects. You won’t even have to solder anything or void any warranties.
For a project I’m working on, I need to emulate the remote for a Lutron Maestro light dimmer. It uses a modulated IR signal, which is a common way for remotes to communicate and is easy to generate with an Arduino. The basic scheme is simple: each command is sent as a series of pulses representing bits, which can be either 1 or 0. To send a 1, you rapidly blink the LED on and off at 38 kHz, and for 0 you leave the LED off. (The 38 kHz modulation makes the signal more resistant to interference from other light sources).
Decoding the Signal
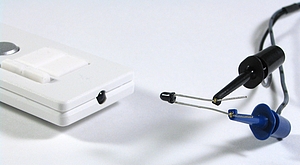
To decode what the remote was sending, I used an oscilloscope and a small photodiode. The photodiode generates a small amount of voltage when light hits it, and responds to changes in light level quickly enough that the oscilloscope can draw a really nice plot of the signal. I have a Parallax USB oscilloscope, which is perfect for showing the command pulses and is just fast enough to find the modulation frequency. As an aside, I’m really happy with the Parallax oscilloscope for projects like this. It is simple to use and I love being able to save images to share with people.
Here’s what two of the commands from the dimmer remote look like. The top signal is the “fade lights up” command, and the bottom one is “fade lights down”:
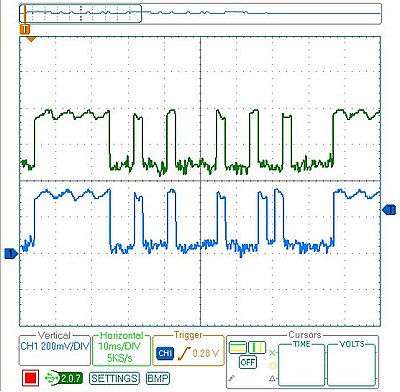
I captured several different commands, then measured the length of all the pulses. Looking at all the commands, a couple patterns are obvious:
- The entire command takes 82.8 ms (after which it immediately repeats, presumably because I held the button on the remote down a little too long).
- The lengths of the on/off pulses are all multiples of 2.3 milliseconds (which means that the entire 82.8 ms command represents 36 bits of data).
- The last four bits are always 0, so really each command is four bytes long, followed by four 0 bits
The particular remote I’m emulating has five commands, and once they are decoded they look like this:
fade up        = [255, 136, 130, 34]
fade down      = [255, 136, 130, 20]
full on        = [255, 136, 132, 184]
full off       = [255, 136, 189, 18]
memory recall  = [255, 136, 132, 183]
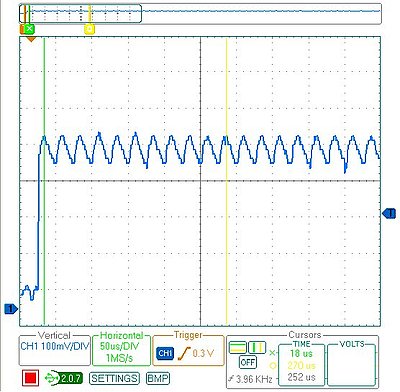
The one other missing piece of information is the modulation frequency which can be measured by zooming in on any of the pulses. This remote uses a frequency of 39.68 kHz. (In the plot below, it says the frequency is 3.96 kHz because I included 10 pulses in the measurement to increase accuracy)
Programming the Arduino
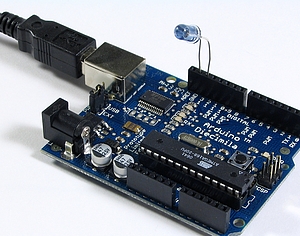
Using an Arduino makes the circuit really simple. I put an IR LED between pin 13 and ground. Since pin 13 has an internal resistor, that’s all that’s required. The code is also pretty straightforward:
/* Control a Lutron Maestro light dimmer */
#define BIT_IS_SET(i, bits)  (1 << i & bits)

// LED connected to digital pin 13
const int LED_PIN = 13;
// Width of a pulse, in microseconds
const int PULSE_WIDTH = 2300;
// # of bytes per command
const int COMMAND_LENGTH = 4;

const int UP[]     = {255, 136, 130, 34};
const int DOWN[]   = {255, 136, 130, 20};
const int ON[]     = {255, 136, 132, 184};
const int OFF[]    = {255, 136, 189, 18};
const int RECALL[] = {255, 136, 132, 183};

void setup()
{
  pinMode(LED_PIN, OUTPUT);
}

/* Modulate pin at 39 kHz for give number of microseconds */
void on(int pin, int time) {
  static const int period = 25;
  // found wait_time by measuring with oscilloscope
  static const int wait_time = 9;

  for (time = time/period; time > 0; time--) {
    digitalWrite(pin, HIGH);
    delayMicroseconds(wait_time);
    digitalWrite(pin, LOW);
    delayMicroseconds(wait_time);
  }
}

/* Leave pin off for time (given in microseconds) */
void off(int pin, int time) {
  digitalWrite(pin, LOW);
  delayMicroseconds(time);
}

/* Send a byte over the IR LED */
void send_byte(int bits) {
  for (int i = 7; i >= 0; i--)
  {
    if (BIT_IS_SET(i, bits)) {
      on(LED_PIN, PULSE_WIDTH);
    } else {
      off(LED_PIN, PULSE_WIDTH);
    }
  }
}

/* Send a full command */
void command(const int bytes[]) {
  for (int i = 0; i < COMMAND_LENGTH; i++) {
    send_byte(bytes[i]);
  }
  off(LED_PIN, 4 * PULSE_WIDTH);
}

void loop()
{
  command(UP);
  delay(1000);
  command(DOWN);
  delay(1000);
}
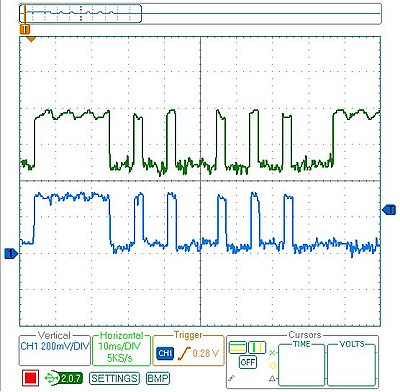
Checking the Arduino with the Oscilloscope
After programming the Arduino, I used the oscilloscope to check the output of the Arduino vs. the original remote. On my first attempt, the wait_time in on() was too long, so the command was stretched out. I hadn’t accounted for the fact that the digitalWrite() calls would consume some time, so I just decreased wait_time until the length of the overall command was correct. As you can see, the final synthesized command overlaps exactly with the authentic one. The green signal on top is from the remote, and the blue signal on the bottom is the arduino:
Final Test
Once everything was ready to go, it was time for the last test: I tried using the Arduino in place of the remote and it worked! It was able to control the light dimmer flawlessly. This lets me finish my project, plus now that I have all the code written it should be easy to adapt to other remote control devices.