I’ve been thinking for a while now about how software engineers can help their communities. Lawyers have pro bono work. Engineers and contractors can help build houses for people. But computer programming is really specialized; most people don’t need custom computer programs. This spring, though, I found a rewarding way to use my computer science skills: teaching kids how to program. I did this though the Citizen Schools program, which encourages members of the community to share what they know with middle school students. It is a really neat idea: the kids get to learn things their school probably doesn’t have the expertise (or time) to teach, and the “citizen teachers” get a chance to help the community and work with some fun kids. The topics which people teach vary widely. For example, here are some of the topics other people were teaching during this last semester:
- Digital photography. The kids presented a gallery of their photos at a local coffee shop.
- The science (and math) of baseball. 10 teenage boys happily doing statistics for an hour. Awesome.
- Make a text adventure game in Javascript. You can play the game they made right now.
- Cooking and nutrition with a chef from one of Google’s famed cafeterias.
So what did I teach?
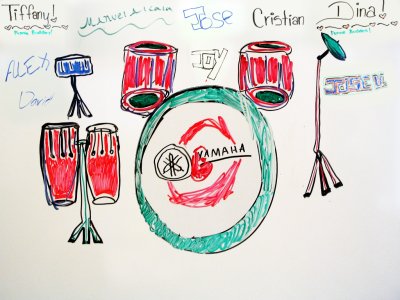
I showed the kids in my class how to use Python to create a drum machine program which plays various drum sounds when you hit different keys on the keyboard. For example, pressing S played the snare drum, C played the cowbell, and B was the bass drum. The finished version of the program had about 20 different drum sounds which the user could play. There were some colorful graphics (drawn by one of the students) showing which drums were being hit. The program could record drum loops, letting the user layer more beats on top of the original beat, and could save and load the sequences of beats. The kids ended up being much better at laying down beats than I was. At the end of the class, the kids presented the program to their parents & teachers, plus had a field trip to a local cafe to demo their work to the community.
What’s it like teaching a class?
Citizen Schools took care of most of the logistics, provided some training on effective ways to teach, and paired us with advisors who helped us work with the children every week. This was really helpful for me, because I was a bit lost figuring out how to present computer programming in a way that middle school students would enjoy. Arturo, my advisor, was super helpful. He worked with the kids every day so he knew them all, plus he had lots of great ideas for ways to present the material and keep the students’ attention.
The semester I taught was a one hour class per week, for ten weeks. That’s not very much time, so I had to work really hard to keep the material short and simple so the kids could learn it. Code is like essays: being terse takes a lot more effort than being verbose. I definitely spent more time preparing for class than I did teaching it.
The kids all knew how to use computers, thanks to myspace, youtube, etc. but none of them had ever written a computer program before. For the first several classes, I would project some simple code and have them type it in and run it. Then I would have them change it or write some similar code. For example, one week we were making the program play different sounds. I showed them how to make it play a snare drum sound, then had them figure out how to make it play a bass drum sound, cymbal sound, etc. They got very good at the repetitive code. There were some one-off lines of code that I don’t think they ever did understand (a function definition, for example).
It was interesting to watch as they learned how to make the computer do what they wanted it to do. I was a little worried a few weeks before the final presentation because the kids weren’t able to explain how to make the program play a new sound. However, when I asked them to code it they knew exactly how to do it. It turns out they just didn’t know the right jargon to explain what they were doing. By the end of the semester, they could make simple modifications to the program to change the way it behaved, or to fix bugs in the code.
Would I do it again?
Will I teach another semester? Yes, I think so. Although it turned out to be a pretty big time commitment this time, I should be able to reuse my lesson plans the next time around so it should be much easier. Like I said at the beginning, it is a really good way to use software engineering skills to help the community and it was really cool to see the students figuring out how to modify their programs on their own. I think that’s reason enough to do it again.
In my 20% time at work, I’ve been writing a Python library for generating charts using Google’s Chart API. It is called graphy, and is now available as open source software on code.google.com.
I’ve frequently wanted to visualize data for various projects I’m working on but have been frustrated because the tools I’ve used are too heavyweight for making simple charts. When the opportunity came up to use the Google Chart API, I jumped at the chance to make a chart library I would enjoy using. The basic philosophy of graphy is to let you present your data naturally and then get out of your way.
I’ll give a couple examples of how it is used. If you’re interested, there are more examples in the user guide and in the source code. First, a simple bar chart showing how population has changed over the past 4 decades in three bay area cities:
from graphy.backends import google_chart_api

cities = ('San Jose', 'San Francisco', 'Oakland')
pop_1960 = (200000, 740000, 370000)
pop_2000 = (900000, 780000, 400000)

chart = google_chart_api.BarChart()
chart.AddBars(pop_1960, label='1960', color='ccccff')
chart.AddBars(pop_2000, label='2000', color='0000aa')
chart.vertical = False
chart.left.labels = cities
chart.bottom.min = 0
print chart.display.Img(300, 180)
That snippet gives this chart:

Next an example using a line chart to compare average temperature trends in two US cities:
from graphy.backends import google_chart_api
from graphy import formatters
from graphy import line_chart

# Average monthly temperature
sunnyvale = \
    [49, 52, 55, 58, 62, 66, 68, 68, 66, 61, 54, 48, 49]
chicago = \
    [25, 31, 39, 50, 60, 70, 75, 74, 66, 55, 42, 30, 25]

chart = google_chart_api.LineChart()
chart.AddLine(sunnyvale, label='Sunnyvale')
chart.AddLine(chicago, label='Chicago',
    pattern=line_chart.LineStyle.DASHED)
chart.bottom.labels = ['Jan', 'Apr', 'Jul', 'Sep', 'Jan']

chart.left.min = 0
chart.left.max = 80
chart.left.labels = [10, 32, 50, 70]
chart.left.label_positions = [10, 32, 50, 70]
chart.AddFormatter(formatters.InlineLegend)
print chart.display.Img(350, 170)
Here’s the resulting chart:

Check out the graphy project page for more information, including the full user guide and source code for graphy 1.0, released under the Apache 2 license.
I’m crafting an economy game using Python and Google App Engine. Called Island of Naru, it is a simulation of a small society on a tropical island. The core design revolves around production and trade:
- Towns produce resources based on the surrounding terrain.
- Towns can trade with each other through a complex trading network.
Because terrain affects production, the location of a town matters. A town surrounded by mountains, for example, can’t grow very much corn, while a town surrounded by corn fields can’t mine very much iron ore. The disparity between locations is what drives the need for towns to trade with each other. By trading with each other, our hypothetical mining camp and farming town can become much more prosperous than they could on their own.
The previous release of Island of Naru added simple trade: cities that were connected by roads could exchange goods. The latest version adds simple production: towns near fields will produce food, towns near mountains will produce raw materials, and towns near factories will produce manufactured good. This change is exciting because it means the core game concept is now playable. In essence, this is the first version of Naru which actually resembles the game I set out to build. Now it is possible to start experimenting with the game design, looking for the fun aspects of it and bringing those to the forefront. Much like a rough draft of an essay, the game needs rework and refinement to bring out the best qualities buried inside it. I’ve already done a little exploring with some changes I’ll talk about below, plus I have some half-formed, fuzzier ideas about where the fun may be hiding that I’ll mention at the end.
As soon as terrain-based production was finished, my first thought for improvement was to make the economy more complex by providing ways to enhance production and by adding another resource type: manufactured goods. Production of raw materials can be improved by digging mines in mountains, while irrigating fields increases the amount of food they will produce. Manufactured goods are only available if you build a factory next to a city. These changes gave the game more depth.
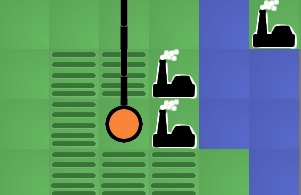
 Next I added exploration. I want the player to have to think about where they build their cities, especially the first one. It should be beneficial to hunt around a little for an ideal site, and I think that with a little tweaking, this can be accomplished now that terrain impacts the city’s production. I’m hoping that exploration will help enhance the feeling of landing on a new island and looking for a good spot to build. The island starts out unexplored except for the beach where you came ashore. You can then explore outward from there. I tried making the player explore one tile at a time, but I found that it took too much time: most of the player’s clicks were spent exploring instead of building. That’s not what the focus of the game should be, so I changed the exploration to uncover several squares at a time, which helped. With exploration, the early game is more interesting because the player has to balance exploring with the need to start a town as soon as possible.
Finally I tried to tweak the numbers behind the economy so towns could grow to larger, more realistic populations. This change took more effort than I expected because it uncovered some problems with the way I was calculating demand and the happiness of the population. Fixing it involved modifying the internals of the supply/demand system to allow more control over the minimum and maximum required amounts for each resource. This not only fixed the problem, but also gave me more control over the balance of the game, which may be useful later. The new numbers don’t seem glaringly low, so the game feels more realistic now.
 Even with these improvements, I feel like the fun is still buried. So where should I look next? I have three guesses. First, I suspect the game needs more depth. There are only three resource types at the moment, for example. The trade is also very simple. A more complicated trading network with bottlenecks and different capacities for different types of roads would be much more interesting to manage. Right now, once a player connects all the cities with roads, there is nothing else to manage. There’s no upkeep, improvement, foreign trade, or ports. I expect adding these details will help a great deal once the game is almost finished, but they should probably wait until the bare skeleton of the game is a little more refined. You don’t start decorating a house until after the walls are finished being built.
My second guess for making the game more fun is adding a goal. In its current state, Naru is just a toy, not a game. Sure, the player can invent a goal for themselves, like “highest island population in 100 moves” or “biggest single city” but self-imposed goals aren’t very powerful motivators. I think imposing some goals and adding a high-score table or two would help add a competitive edge to the game. I may add a simple goal just to give some direction to the player and avoid confusion about what they are supposed to be doing, but fancier changes like multiple goals or score tracking need to wait until the core idea provides more fun on its own. High score tables enhance existing fun, they don’t magically make boring tasks fun.
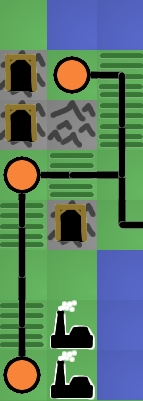
I think the biggest thing hiding the fun is lack of resource constraints on the player. They can build everything for free, so nothing feels valuable. For example, the player should have to agonize a little over the perfect location for their first city, but right now there’s no need: if they find a better location later they can always just build a city there. Similarly for roads: the player should feel a sense of accomplishment when they manage to add a new city to the trading network but since roads are free this isn’t difficult and there’s no sense of accomplishment. A typical game goes something like this: build a city in the flatlands, build a second city by the mountains, build 4 road segments to connect them, build a factory, uhh, now what? 7 moves into the game the player already has access to every resource. Each new city gets connected to the others in a handful of moves, and the end result is that the player doesn’t spend any time thinking about the trading network.
I’m going to try the standard solution to this problem: gold. Make the player pay for building cities and roads, so they are more valuable. I’m not sure what the mechanism will be for getting money in the world. Sim City had taxes to raise money, Oasis let you search for followers in the desert, Civilization made you use special “settler” units that were difficult to obtain. Any of these would work; the key thing is that the player has to make choices about what they want to build with limited resources.
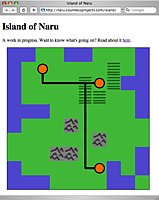
If you want to play the game now, even though the fun may still be elusive, go to http://naru.countlessprojects.com. Feedback is always welcome, of course. You can leave it below. I’d be especially interested to hear any thoughts about refining game designs to uncover hidden fun within them.
The latest installment of Naru (an island economy game) joins the economy simulation and the island maps. Now when you create an island, it will have the economy engine I wrote about earlier running behind the scenes. This means that cities can trade with each other if you connect them with roads. By clicking on the city names, you can control the production levels of the cities and see graphs of population trends in the city.
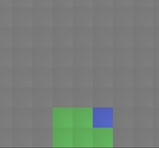
I also improved a few issues in the UI. The squares of the map are now shaded slightly, making it easier to click the square you intended to. Also, cities will automatically connect to roads now; you don’t have to build both a city and a road on the same square.
Normally there are all kinds of aspects to a simulation that are driven by mathematical functions, like gravity, momentum, population growth rates, economic trends, etc. However, mathematical functions can be difficult to tweak, and I’m finding it much easier to use lookup tables instead. This makes it much easier to make slight modifications: rather than adding additional terms to a function, I just have to modify the values in a table.
I wrapped up the logic for storing a table of points and providing interpolated values between those points into a Python class. Using Python’s __getitem__ method lets my object behave like an array, so I can just index into it when I need a value. Here’s the class:
class InterpolatedArray(object):

  """An array-like object that provides
  interpolated values between set points."""

  def __init__(self, points):
    self.points = sorted(points)

  def __getitem__(self, x):
    if x < self.points[0][0] or x > self.points[-1][0]:
      raise ValueError
    lower_point, upper_point = self._GetBoundingPoints(x)
    return self._Interpolate(x, lower_point, upper_point)

  def _GetBoundingPoints(self, x):
    """Get the lower/upper points that bound x."""
    lower_point = None
    upper_point = self.points[0]
    for point  in self.points[1:]:
      lower_point = upper_point
      upper_point = point
      if x <= upper_point[0]:
        break
    return lower_point, upper_point

  def _Interpolate(self, x, lower_point, upper_point):
    """Interpolate a Y value for x given lower & upper
    bounding points."""
    slope = (float(upper_point[1] - lower_point[1]) /
             (upper_point[0] - lower_point[0]))
    return lower_point[1] + (slope * (x - lower_point[0]))
You use it like this:
points = ((1, 0), (5, 10), (10, 0))
table = InterpolatedArray(points)
print table[1]
print table[3.2]
print table[7]
Here are some examples of the kinds of curves you can easily make:

points = [(0, 0), (2, 9.5), (4, 8.5), (6, 4), (8, 1), (10, 0)]

points = [(0, 10), (2, 10), (4, 9), (6, 7), (8, 4), (10, 0)]

points = [(0, 0), (2, 0), (4, 1.5), (6, 8.5), (8, 10), (10, 10)]
Feel free to use this in your own projects.
 After prototyping the basic map editor, I’ve switched to working on the backend of Naru recently. Specifically, I’ve been working on the simulation of the island’s economy, which is going to be the meat of the game.
My approach has been to create a dashboard that exposes the interesting stats and graphs them over time. I’m trying to make it easy to visualize what happens when I tweak the various values. I’ve found the graphs to be really helpful in illustrating how trends work their way through the system. I can do something like connect two cities (so they can trade), then run through several turns watching how the populations grow & shrink until they hit a new steady state.
I think I have the simulation to a point where it is starting to be convincing. The population of each city depends on whether the citizens are happy, which in turn depends on whether their needs are met. For example, if they don’t have enough food, they will be unhappy and will eventually move away. If they have an abundance of food, they will be very happy and more people will move in to the city. At the moment I only have 2 resources in the simulation: food and raw materials (which could some day be turned into manufactured goods in a factory). Cities can be connected by roads, in which case surpluses can be distributed to other cities. This means that the total population of the island should increase as more towns become connected (because the surpluses won’t be wasted). The only control the player has is over the amount of resources produced by each city and the road connections between cities.
If you want to play with the simulator, you can get started by going to http://naru.countlessprojects.com/island/economy
I’m pretty sure there are still lots of bugs in it. I haven’t written tests for most of the code because it is still very much a prototype. Still, any feedback you have would definitely be appreciated.
This post is about being productive. It is also about drawing charts, Google App Engine, and monkeys. But mostly about being productive.
For a couple years now I’ve been running a project night. Once a week, myself and a few friends get together to work on whatever projects we’re currently involved with. The goal is to sit down and get stuff done, in the company of other productive people.
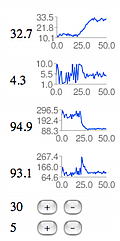
Last week, a friend and I decided to collaborate on a service for recording and charting measurements. The basic problem we’d be solving: “I want to measure some property X every N seconds and then draw a chart of the data.” The service would take care of aggregating the data and drawing charts. The user of the service would just have to write a client to periodically report measurements.
We set ourselves a challenge: try to finish a (very) rough end-to-end prototype in 2.5 hours. It would have a simple API for reporting new data points, a web page where you could view the charts, and one example client. Here’s what we managed to get done:
The whole things is done using Django on Google App Engine. There’s a simple REST API for posting new measurements, and a simple web interface for viewing the charts (which are drawn using Google Chart API).
Some observations from the project:
Picking a name is hard. Unless you’re in a hurry, in which case it becomes easy: you just pick the first name someone shouts out that isn’t taken. Stats Monkey was the first name that passed this test for us.
Having two people sitting next to each other made it much easier to stay in scope. When one of us was about to waste time over-doing something or going off on a tangent, the other one would step in. I don’t think we would have finished the project if we hadn’t been sitting next to each other announcing what we were about to do.
We both already had a lot of experience with all the tools we were using. This really helped, because there was basically no setup time. Google Code and App Engine both have really low startup costs for a project like this. I think maybe only 10-15 minutes were spent getting a subversion repository and hosting.
We hit a lot of SVN conflicts. We also had trouble with incomplete syncs/commits because we were both used to p4 semantics (where a commit includes files from the entire workspace, not just the current directory). It would be worth trying to mitigate this if we try something like this again.
The code is full of bugs and security holes, and doesn’t have any tests. Since we just barely made our deadline, I don’t think this was a mistake. We didn’t hit any major roadblocks, but this was probably just luck.
I’ve finished a first pass at building cities on an island. You can create a new island* and then start building on it. You can start cities, build roads, and irrigate bare land to create fields. There’s also a terraforming menu, so you can flatten mountains and fill in the ocean if you want. Terraforming won’t be there in the finished game, but makes it easier to play around with different island shapes at this stage. Some of the basic building logic is implemented (so you can’t build a road across mountains, you can’t build a city in the water, etc.)
The interface is…simple. It is the simplest interface that could just barely be construed as working. I’ll definitely be spending more time on this, but I want to get the core of the game working first.
As I hinted at in my last post, I’m writing this game in 2 distinct parts:
1) A library which implements a simple island economy game
2) A django app which puts a nice user interface on this library
By implementing my core game logic as pure (non-django-related) python, I have a bit more freedom writing tests and experimenting. I’m just writing normal tests using the unittest module. I’ve started on a basic economy, and so I have a couple command-line programs that let me poke around at different parameters trying to get something reasonably stable and convincing.
The live version is running at http://naru.countlessprojects.com. If you try it out, I’d appreciate any comments, questions, or feedback you might have.
* For now, I’m requiring sign-ins using google accounts. This was the fastest way for me to make sure no one else can edit your maps. I definitely want to allow instant, no-sign-in play later, but right now there are much bigger features to tackle.
I’m finding that BlobProperties are a very handy way to optimize for the App Engine Datastore. The first iteration of my island map had a Map model, and a Tile model. It used entity groups, so one Map entity was the parent of 100 Tile entities. Nice and clean, and of course dog slow. You don’t want to be loading 101 entities with every request if you can avoid it.
I added some quick-and-dirty benchmarking to time the datastore calls and then tried several different approaches. The one I settled on was BlobProperties and pickle. Basically, my Map model has a BlobProperty which stores all the tiles in pickled format. When I load the map out of the datastore, I use pickle.loads() and before I save the map back, I use pickle.dumps(). This means that I only have to load a single entity out of the datastore to display a map.
Nice side benefit: My core game logic is now pure python, so it is really easy to work on it outside of app engine (or even django). This is handy when writing benchmarking tools, testing, and prototyping new algorithms.
Possible drawback: I think I will hit compatibility problems if I try to load old pickled objects after renaming python modules. If this becomes a problem, I plan to start pickling an intermediate format like a dict instead of full objects.
Some of the folks at Google have released a sweet Google App Engine Helper for Django. It consists of a skeleton Django project with all the little tweaks necessary to run on top of App Engine, and it makes it really easy to get started.
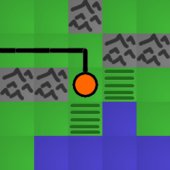
I used the helper to start a simple Django app that shows tiled maps, using the images I previously created. Making a map generator is way, way down on the list of things that might possibly make this game fun, so I just quickly made three 10×10 islands manually. Here’s the code which generates the island in the screenshot:
island1 = _Expand("""O O L L O O L L L O
O L C_road_s L L L L F L O
O L L_road_en L_road_ew L_road_ew F_road_esw C_road_w F O O
O L L L L F_road_ns F L L O
O O O L L L_road_ns L L L O
O L L L M L_road_ns L L L L
L L L L L L_road_ns M L L L
L L L M M L_road_ns L L L O
O L L L L L_road_en C_road_w O L O
O O O L L L L O O L""")
The app picks one of the three islands randomly and spits out an HTML table containing the image tiles. A little bit of CSS makes it fit together without borders/gaps:
table {
  border-collapse: collapse;
}

td, tr {
  line-height: 0;
  padding: 0;
}

.island {
  border: solid 1px black;
  float: left;
  margin: 1em;
}
If you want to see it live, the latest version is running here.