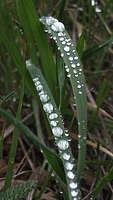
 It’s springtime and flowers are coming out! To celebrate, we went hiking at Henry Coe last weekend. The park is at its most beautiful this time of year, with green hills and lots of flowers. The weather was cool (bordering on cold) and a little damp. There was dew on the grass & flowers and it lasted all day in the shade.
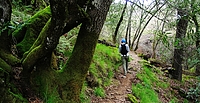
 We went in from the main entrance and hiked to Frog Lake, along the Monument trail. I really like the top of the Monument trail. There’s a spot where the hill opens up and has some tall pine & oak trees. It was very quiet except for the wind blowing in the trees. From the top, the trail descends down to Frog Lake. Anywhere else, this would count as a steep descent, but compared to some of the other trails at Henry Coe, this one is only a moderate descent. We forgot about the park’s tendency for steep trails and didn’t bring our hiking poles; we’ll want to remember them next time.
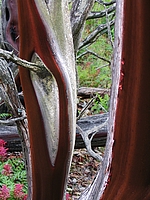
Frog Lake is a little reservoir with a few dead trees sticking out of it. I think this was the smallest lake we’ve been to at the park (not counting the small water ponds that are so valuable in the summer). From here, we hiked up to Middle Ridge and headed east. This trail alternates between open oaks forest and cutting through thick brush . The Manzanita trees are truly impressive. Normally a small bush, the specimens here are full-blown trees.
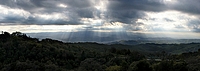
After hiking along the ridge we took a right turn and crossed the creek to start climbing back to the park headquarters. By this point, our knees were definitely starting to feel all the climbing and descending we had done, and we were ready to be back at the car. To cap off this nice springtime hike, we had the most beautiful clouds over Gilroy on the drive home. The sunbeams shooting through the clouds were beautiful, and lasted for quite a long time.
More Pictures
I’ve been trying Google Spreadsheets for tracking exercise & training this summer and it has worked out really well. They are really simple, provide just enough charting ability, and can be shared. That last bit is really helpful if you’re training for an event with a friend. You can also embed your training graphs on your website. I’ll show you how I set up a couple different shared spreadsheets for different goals.
Biking to Work
First, a fairly simple one: Yana and I set a personal goal to ride our bikes to work 40 times this quarter. This works out to a little over 3 days per week, average. I wanted a simple chart of our progress, so I made a table with 6 columns: Mark, Yana, Date, Target, Mark’s Total, and Yana’s Total. The first two columns are for entering data, the last 4 columns calculate the data for the chart. I intentionally didn’t put the Date column first. Google Spreadsheet can only graph contiguous data, so I needed to keep the date column next to the target & totals.
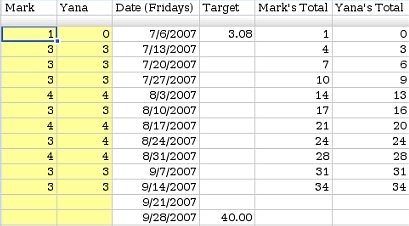
The first two columns track how many days we each rode that week (1 row per week). Each day we rode, we would manually increase the count for the current week. I made their background yellow to make it more obvious where to enter new data.
The target column shows our goal on the chart so we can see how we are doing. The last two columns calculate running totals (simply a matter of adding this weeks values to last week’s totals). I charted the last 4 columns (C1:F14) using a line chart with dots, with both Row 1 and Column C as labels.
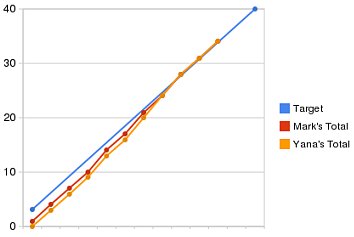
You can see that we started the quarter a little bit behind but we caught up 3 weeks ago. You can view the final spreadsheet here.
Training for a Long Hike
Last weekend, Yana and I hiked Half Dome with some friends. It’s a fairly strenuous hike: 18 miles round trip, 5000 feet of climbing at elevation. We’ve done this hike before, but this year we decided we try to semi-seriously train for it, to see if it made it easier. We started training 12 weeks before the hike with a pretty simple training plan: do a long hike on the weekends with 1 or 2 short hikes mid-week, increasing the total mileage by about 3 miles per week.
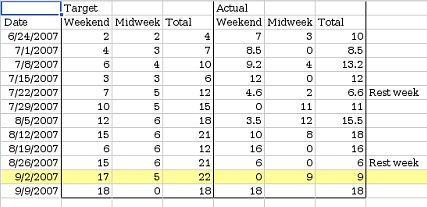
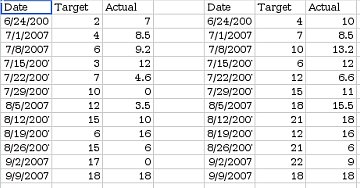
Again, I set the spreadsheet up with 1 row/week. I entered target mileages and set up an area where we could enter our actual mileages. I set up 2 charts this time: One showing our longest hike every week, and one showing our total mileage every week. Rather than trying to arrange the data I wanted to chart contiguously, I just made a 2nd sheet with formulas to rearrange the data into something more chart-friendly.
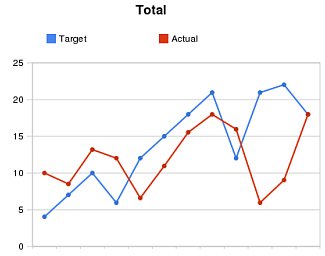
I shared this spreadsheet with our friends and updated it after every training hike (you can view it here). As you can see, we didn’t stick very closely to our training plan. It turns out hiking this much eats up a lot of time, and there were some weekends where we just couldn’t fit in a long hike. However, we still got quite a bit of training, and managed to fit a 16 mile hike in 3 weeks before Half Dome. Seeing our actual mileage so far below the target mileage provided good motivation to go for training hikes. The hike up Half Dome went really well: we were faster than last time, and had more energy at the end of the hike.