Think the periodic table is just a boring collection of numbers? I suppose the one in your chemistry textbook might be. But it doesn’t need to be this way. Each element is interesting on its own, with a unique appearance, a history of how it was discovered, and different practical uses. Together as a collection, the elements show all kinds of interesting patterns that just beg to be explored.
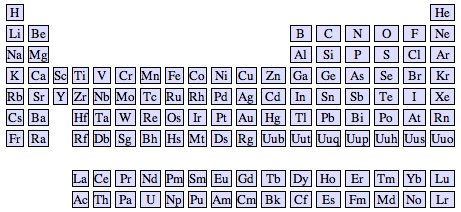
Element Explorer is my attempt at making the periodic table an interesting toy instead of a dry, dusty pile of numbers. You can click on any element to view more details about it. There are links to take you to Wikipedia or the Wooden Periodic Table to see pictures and read about the element.
If you’ve got Javascript enabled, the menu in the lower left lets you color the elements differently to highlight different patterns. Coloring by mass, for example, shows that atomic mass increases smoothly with atomic number (as expected). Color by discovery date and you’ll notice that Technitium (43) was discovered almost 100 years after its neighbors. Scientists knew it must exist from the gap in the table, but it proved elusive because, unlike its neighbors, it isn’t stable.
Now go have fun exploring.
Some technical details: The raw data (atomic weights, date of discovery, etc.) was originally retrieved from Wikipedia. I then used Python, JSON, and Django templates to generate the HTML. The zooming & other visual effects are powered by a mixture of Prototype and Scriptaculous.