Trying to get started with AVR microcontrollers, but bewildered by the sheer number of options? So was I, a short time ago. It took several weeks of reading before I felt like I understood how everything fit together. I’ll write it down and hopefully save you a couple of weeks.
(A short aside: if the rest of the post makes it clear that AVRs are too much for you, consider getting an Arduino. They have an AVR chip in them, but are easier to use.)
First, let’s look at what a complete setup looks like:
- AVR chip
- The rest of the circuit
- Hardware programmer
- Software to run the programmer
- Compiler toolchain for your language of choice (assembler or C)
AVR Chip
There’s a huge spectrum of options in the different AVR chips. Don’t worry though, they are all fairly compatible in terms of learning how to program them. They differ in how much memory they have, how many fancy peripherals (like ADCs, UARTs, PWM generators) they contain, what package they come in, and of course how much they cost. You just need to pick the chip that has the right combination of features for your application. If you just want to play around, I’d suggest getting one of the fancier AVR chips, like an ATmega168. Then you’ll have plenty of features for whatever you want to try.
Atmel has a nice product grid that lets you quickly compare the different chips.
If you really need a specific feature for your project, be sure to double-check the datasheet and make sure there isn’t some little gotcha waiting there. Lots of features share pins or internal hardware, or have unexpected restrictions, so you need to understand the datasheet. For example, the timer and PWM generator may share the same counter internally, or one of the output pins might be shared with a pin used by the programmer.
Here’s a suggestion for saving a lot of time: Start with an over-powered chip. Sure, those 8-pin chips are cute, but they don’t have very many peripherals or memory. When you realize you need a 2nd UART which you don’t have, or that you really need 256K more memory, you’ll be sad. Instead, start with one of the fancier chips and use the extra hardware to get your project done sooner. Then, if you still want it to run on a smaller/cheaper chip, you can start optimizing your software and writing bit-banging routines to replace the peripherals.
ISP Header
The only AVR-specific part of your circuit is an ISP programming header. This is where you plug in the programmer to download your software onto the AVR chip. It is really easy to build a small ISP adapter that plugs into your breadboard. I explained how I built one here. I suppose you could also just jam wires into your breadboard, but that would be messy.
You’ll want a solderless breadboard to prototype your circuit in (later, once it is perfect, you can move it to perfboard or a PCB, but until the circuit it perfect you’ll be changing it a lot so you want to start on the breadboard). You need some kind of power supply. I built one of these on the corner of my breadboard. You could also use batteries, or the +5 line from a USB connection.
Programmer (Hardware)
This piece of hardware is how you get your programs onto the AVR chip. There are a lot of options, but many of them are outdated. What you want is a USB programmer that does In-System Programming (ISP). Examples:
Whatever one you get, you need to be sure that it will work with your programming software.
Programming software
You need software to control the programmer (confusingly, this software is also occasionally called a programmer). There are a bunch of different pieces of software to do this but the most common 2 seem to be AVR Studio and avrdude. Both are free. Avrdude supports a ridiculous number of different programmers, but you probably want to double-check and make sure the one you are about to buy is supported.
Compiler toolchain for your language of choice (assembler or C)
You can program the AVR in either assembler or C. Since we want to pick the easy road, that narrows it down to C. As far as I can tell, all the different IDEs and tools end up using avr-gcc under the covers. So, you need to get the avr-gcc toolchain:
- Windows: WinAVR
- OSX: OSX-AVR
- Linux: For Ubuntu, you can get slightly outdated versions from apt: apt-get install binutils-avr gcc-avr avr-libc
Where to Go From Here
Ok, you’ve collected all your hardware & software. Now you need to put it all together. Fortunately, there’s already a lot of great information out there on how to get started with blinking some LEDs. Here are some links to get you going:
SparkFun’s tutorials
Piconomic Design’s tutorials
Here’s an interesting contrast: Professional writers down in Hollywood are walking off the job (they want more money), at the same time thousands of amateur writers are attempting to write a 50,000 word novel in 30 days (they want a challenge).
The Writer’s Guild of America is striking because they want a bigger cut from all the new revenue streams that keep popping up, like DVDs and the Internet. I don’t know enough to comment on their demands, but I do know that they have hilarious timing: they decided to strike during National Novel Writing Month. Every November, thousands of enthusiastic writers try to finish a 50,000 word novel in 30 days. Last year, there were almost 80,000 registered participants and 13,000 who actually finished their novel. In contrast, about 12,000 WGA members are striking.
I wouldn’t expect the Novel Writing Month folks to produce the same quality of writing. After all, if you’re trying to spit out 50,000 words in 30 days, you obviously have to choose quantity over quality. However, I love the refreshing reminder that you don’t need to be a professional to write. You just need to sit down and do it.
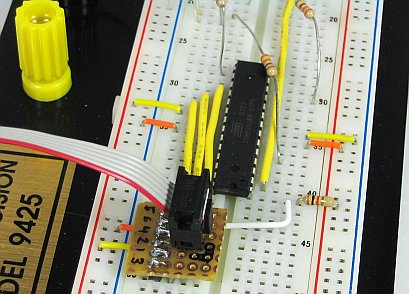
Using an AVR in a breadboard can be a bit ugly because programmers like the AVRISP mkII and the USBtinyISP can’t easily be plugged into a breadboard.
You can simply stick wires in the programmer’s jack and plug them into a breadboard (like they do here) but if you want something a little cleaner you can solder up a simple header board like this:
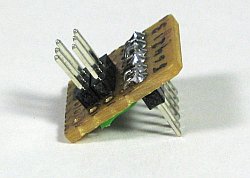
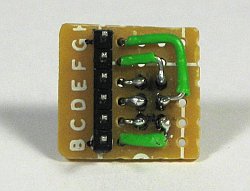 You just need a small piece of perfboard, a 2×3 pin header block, a 6-pin header row, and a little bit of wire. I found it was easier to route the wires if I didn’t bother trying to get the output pins to be sequential. Solder it together and you can leave it in your breadboard, ready for whenever you need to reprogram your microcontroller.
I’ve been trying Google Spreadsheets for tracking exercise & training this summer and it has worked out really well. They are really simple, provide just enough charting ability, and can be shared. That last bit is really helpful if you’re training for an event with a friend. You can also embed your training graphs on your website. I’ll show you how I set up a couple different shared spreadsheets for different goals.
Biking to Work
First, a fairly simple one: Yana and I set a personal goal to ride our bikes to work 40 times this quarter. This works out to a little over 3 days per week, average. I wanted a simple chart of our progress, so I made a table with 6 columns: Mark, Yana, Date, Target, Mark’s Total, and Yana’s Total. The first two columns are for entering data, the last 4 columns calculate the data for the chart. I intentionally didn’t put the Date column first. Google Spreadsheet can only graph contiguous data, so I needed to keep the date column next to the target & totals.
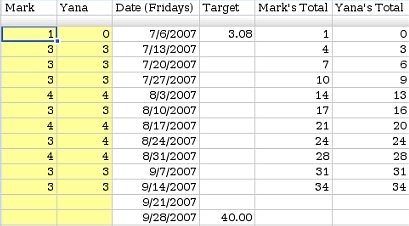
The first two columns track how many days we each rode that week (1 row per week). Each day we rode, we would manually increase the count for the current week. I made their background yellow to make it more obvious where to enter new data.
The target column shows our goal on the chart so we can see how we are doing. The last two columns calculate running totals (simply a matter of adding this weeks values to last week’s totals). I charted the last 4 columns (C1:F14) using a line chart with dots, with both Row 1 and Column C as labels.
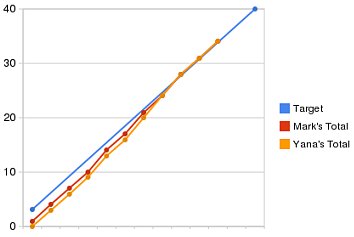
You can see that we started the quarter a little bit behind but we caught up 3 weeks ago. You can view the final spreadsheet here.
Training for a Long Hike
Last weekend, Yana and I hiked Half Dome with some friends. It’s a fairly strenuous hike: 18 miles round trip, 5000 feet of climbing at elevation. We’ve done this hike before, but this year we decided we try to semi-seriously train for it, to see if it made it easier. We started training 12 weeks before the hike with a pretty simple training plan: do a long hike on the weekends with 1 or 2 short hikes mid-week, increasing the total mileage by about 3 miles per week.
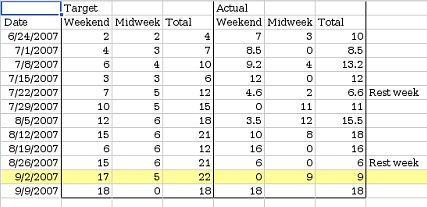
Again, I set the spreadsheet up with 1 row/week. I entered target mileages and set up an area where we could enter our actual mileages. I set up 2 charts this time: One showing our longest hike every week, and one showing our total mileage every week. Rather than trying to arrange the data I wanted to chart contiguously, I just made a 2nd sheet with formulas to rearrange the data into something more chart-friendly.
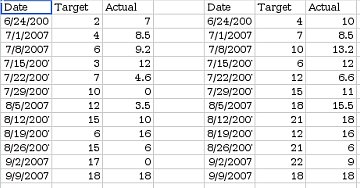
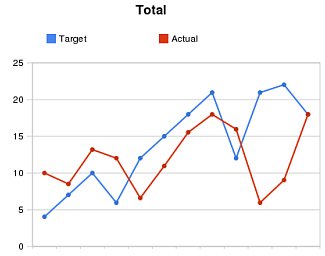
I shared this spreadsheet with our friends and updated it after every training hike (you can view it here). As you can see, we didn’t stick very closely to our training plan. It turns out hiking this much eats up a lot of time, and there were some weekends where we just couldn’t fit in a long hike. However, we still got quite a bit of training, and managed to fit a 16 mile hike in 3 weeks before Half Dome. Seeing our actual mileage so far below the target mileage provided good motivation to go for training hikes. The hike up Half Dome went really well: we were faster than last time, and had more energy at the end of the hike.
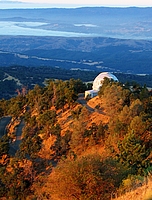
Piaw, an avid bicyclist at work, led a moonlit bike ride up Mt. Hamilton last Sunday.
 It was incredible. We started at 3 AM, so the first part of the climb offered views of the moon high over San Jose. The air was cool, a nice temperature for climbing. After gaining the ridge we left the lights of San Jose behind and rode on through the darkness, past grassy hills and scattered oaks. The road twists through two valleys, and as we dropped into each low spot, we sped through the icy cold air that had settled there, before reaching the warmer air on the other side. The black sky slowly gave way to a dark blue, the moon seemed to get larger as it set over the Santa Cruz mountains. Coming around the last corner before the top we could finally see out to the eastern horizon which was glowing the pre-dawn colors. As the sun came up we watched the light flow out over the sleeping hills below. After eating breakfast with Piaw’s friend (who graciously got up to serve us in her house) we rode back down through the bright sunlight and rapidly warming air.
The ride, in a few photos.
The ride, as a GPS track (.gpx format)
The ride, by the numbers:
- Start time: 3 AM
- Number of riders: 5 to 9 (some started later)
- Total Distance: 34.8 miles
- Total climbing: 3814 feet
- Time to the top: 3 hours
- Total time (including breakfast): 6 hours
- Number of flat tires: 4
 That’s right: 4 flats between the different riders. After about 15 minutes of climbing I stopped to take a picture and when I got back on my bike to catch up to the group, I had a flat tire. This was rather demoralizing, so early in the ride, in the dark, alone. When I finally caught up with them, they were stopped changing another flat, so I didn’t feel so bad. When a third rider got a flat 10 minutes down the road, it started being ridiculous, and by the fourth flat we were counting our spare tubes. We finally got caught by some riders who started later, and they told us that the side of the road where we had parked was covered with goathead thorns. We carefully checked our tires (found 1 thorn in Yana’s tire that hadn’t punctured it yet) and that was the end of the flats.
This ride was easier than we expected. The weekend before the ride, Yana and I weren’t sure we could do it, so we went out and rode Moody/Page Mill. Surprisingly, the longer Mt. Hamilton turned out to be easier. I think this was primarily because Mt. Hamilton has a shallower grade. Page Mill is steep enough that I really had to push to keep moving, while on Mt. Hamilton I was able to keep a comfortable cadence (and lower heart rate).
Lessons learned:
- It is easy to miss thorns in the dark. Double-check your tires before you start, and stay on the pavement.
- Patches don’t take much space, make sure you have lots (in case you miss the thorns in the dark…).
- Helmet-mounted headlamps are very helpful for changing flats in the dark.
- Don’t push on the last mile of climb when there’s still some climbing on the ride back.
- Slope is more important than distance in determining how hard a ride is.
- My eTrex GPS doesn’t save tracks at full resolution, it simplifies them first. I will get a better track by pulling the active log rather than a saved track.
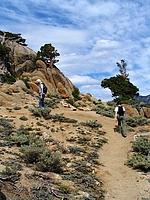
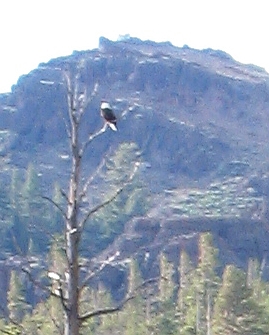
We went camping last weekend, up near Lake Alpine. We went up Saturday and got a campsite at Pacific Valley campground. I had wanted to drive out to Highland Lakes but the road was closed for the Death Ride. We set up camp, ate lunch, and then everyone laid around for an hour or two. Around 4 we decided to hike to Kinney lakes to go swimming. I think it is about 2 miles from Ebbetts Pass to the lakes, on a fairly level trail.
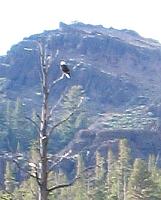
It was a little windy but the water wasn’t very cold (64° F). We hiked around the lake looking for the best possible swimming spot and right where we had started, on the southwest side. As we were getting ready to leave, we noticed some kind of large bird in a dead tree on the other side of the lake. It looks like a Bald Eagle to me, although perhaps it was just an Osprey. The lighting made it really hard to see (not having a zoom lens doesn’t help anything either).
On Sunday we broke camp and drove up to Mosquito Lake so that we could hike into Bull Run Lake. The sign said it was only 3.5 miles to the lake, but neglected to mention that there is a lot of gratuitous climbing. It was well worth it though, because the lake is gorgeous. The water is extremely clear and there is a small island in the middle of the lake. We swam out to the island and back, then ate lunch and hiked out.
More Photos
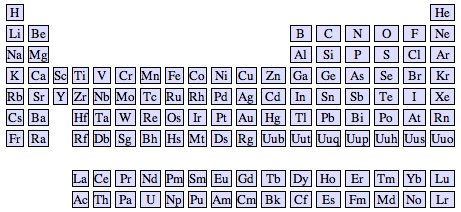
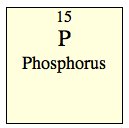
Think the periodic table is just a boring collection of numbers? I suppose the one in your chemistry textbook might be. But it doesn’t need to be this way. Each element is interesting on its own, with a unique appearance, a history of how it was discovered, and different practical uses. Together as a collection, the elements show all kinds of interesting patterns that just beg to be explored.
Element Explorer is my attempt at making the periodic table an interesting toy instead of a dry, dusty pile of numbers. You can click on any element to view more details about it. There are links to take you to Wikipedia or the Wooden Periodic Table to see pictures and read about the element.
If you’ve got Javascript enabled, the menu in the lower left lets you color the elements differently to highlight different patterns. Coloring by mass, for example, shows that atomic mass increases smoothly with atomic number (as expected). Color by discovery date and you’ll notice that Technitium (43) was discovered almost 100 years after its neighbors. Scientists knew it must exist from the gap in the table, but it proved elusive because, unlike its neighbors, it isn’t stable.
Now go have fun exploring.
Some technical details: The raw data (atomic weights, date of discovery, etc.) was originally retrieved from Wikipedia. I then used Python, JSON, and Django templates to generate the HTML. The zooming & other visual effects are powered by a mixture of Prototype and Scriptaculous.
Without further introduction, 8 conceivably useful applications of Google’s new Street View:
- Find parking before you get in the car.
- Find a store’s hours
- Check if you can pay by credit card (courtesy of Damon Kohler).
- Look up a phone number
- Thinking of moving? Check out the neighborhood. Maybe you’ll find it a bit out of your price range.
- Can I sit while I wait for the bus?
- Will I be out of the rain while I wait for my bus?
- Should I bring loose change for the parking meter?
(Ok, so some of those are pushing it a bit. If I’m optimistic, I can see how this could become very useful, instead of just being used to spy on housecats.)
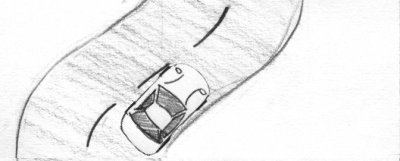
A couple weekends ago I wanted to play around with some game ideas, to see if they were super-awesome or boring. I needed a simple framework to prototype them on, so I whipped one out using pygame. Then I sketched up some art. And made an installer.
And totally forgot to play around my original game ideas.
Damn. Maybe next time.
Anyway, here it is: a simple scrolling demo made with python and pygame. It has no real purpose (unless you want to do scrolling in pygame).
OSX
Windows
Source (Linux)